GBP/USD Forecast: British pound looks to capitalize on risk flows
- GBP/USD has been moving sideways near 1.3600 following Wednesday's drop.
- Market mood turns positive amid easing concerns over energy inflation.
- Break above 1.3640 resistance is required for GBP/USD to extend its recovery.

British Prime Minister Boris Johnson's optimistic remarks failed to help the British pound gather strength and the GBP/USD pair lost 50 pips while snapping a four-day winning streak on Wednesday. Amid a lack of high-tier data releases, the pair seems to have gone into a consolidation phase around 1.3600 on Thursday, buoyed by risk flows.
While speaking at the Conservative Party Conference on Wednesday, Johnson said that they will not use immigration as an excuse for the failure to invest and added that they are going to be a "high wage, high skill and low tax economy." Although these remarks had little to no impact on the GBP's performance against its rivals, the modest selling pressure surrounding the USD kept the pair's downside limited.
Rising US stocks on renewed hopes for a temporary solution to the debt crisis caused the greenback rally to take a break. Lawmakers are expected to vote on the temporary solution late Thursday.
In the meantime, Russian President Vladimir Putin announced that they will increase the gas supply to ease the pressure on energy prices and allowed risk flows to return to markets. Reflecting the upbeat market mood, the UK's FTSE 100 Index opened decisively higher and was up 0.8% at the time of press.
The US Department of Labor's weekly Initial Jobless Claims will be the only data featured in the US economic docket. On Wednesday, the ADP Employment Change arrived at 568,000 in September, surpassing analysts' estimate of 428,000. Investors will keep a close eye on Wall Street's main indexes in the second half of the day but GBP/USD is likely to move within technical levels ahead of Friday's September jobs report from the US.
GBP/USD Technical Analysis
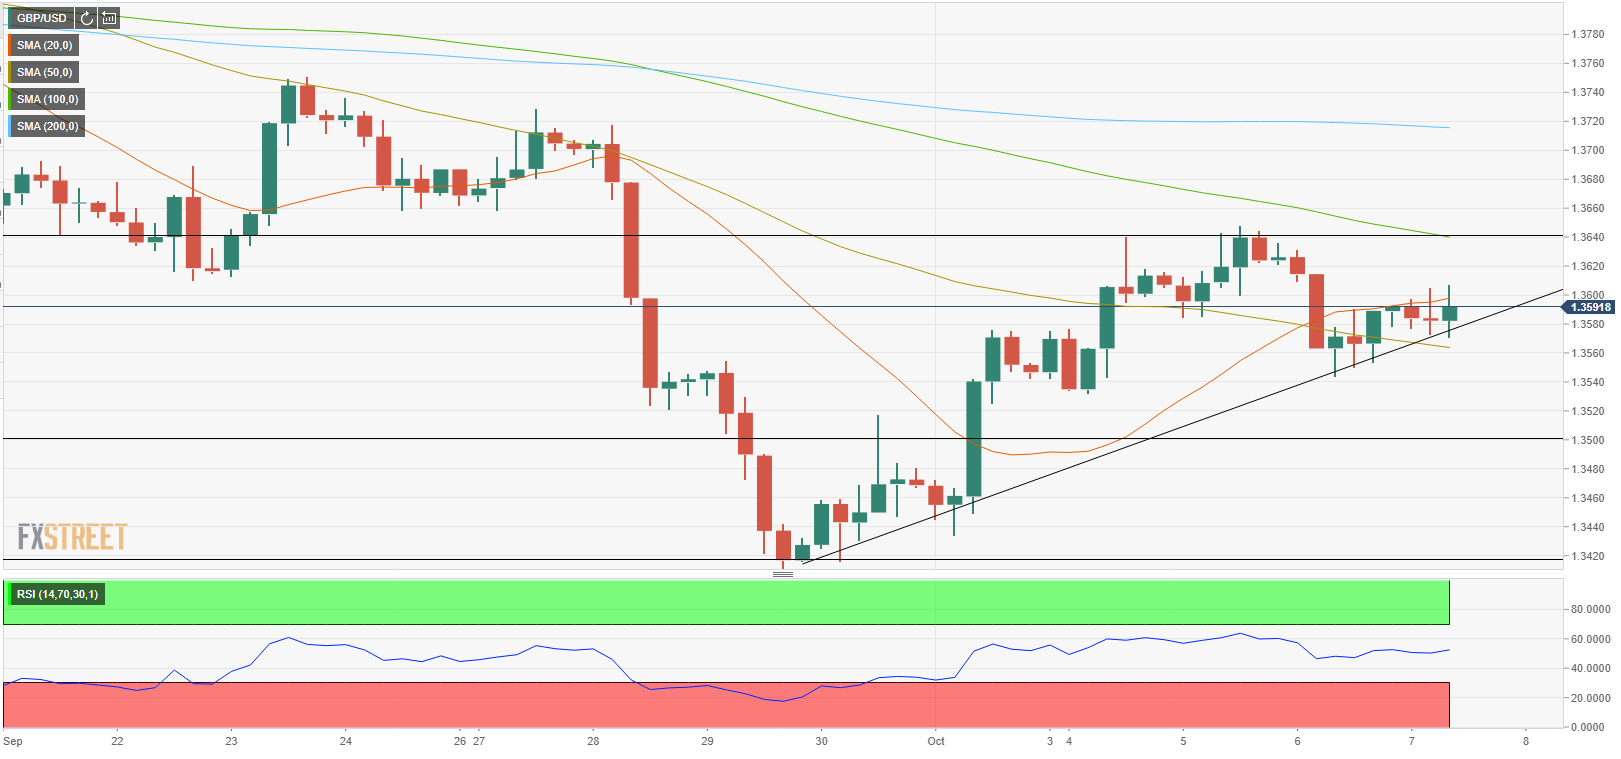
On the four-hour chart, GBP/USD is fluctuating between the 20-period and the 50-period SMAs. Punctuating the pair's indecisiveness, the Relative Strength Index (RSI) indicator on the same chart is moving sideways near 50.
On the upside, the initial hurdle is located at 1.3600 (psychological level). In case buyers manage to flip that level into support, the next key resistance aligns at 1.3640 (static level, 100-period SMA). Only a daily close above that level could pave the way for a stronger recovery toward 1.3720 (200-period SMA).
The near-term ascending trend line coming from late September is forming the first technical support at 1.3570, which is also reinforced by the 50-period SMA. 1.3500 (psychological level) and 1.3420 (cycle-low) could be revisited if the trend line fails to hold.
Premium
You have reached your limit of 3 free articles for this month.
Start your subscription and get access to all our original articles.
Author

Eren Sengezer
FXStreet
As an economist at heart, Eren Sengezer specializes in the assessment of the short-term and long-term impacts of macroeconomic data, central bank policies and political developments on financial assets.


