- GBP/USD has failed to stage a convincing rebound this week.
- Tehnical outlook suggests that there is more room on the downside before the pair turns oversold.
- Investors keep a close eye on US Treasury bond yields.
After failing to break above 1.3400, GBP/USD has met fresh selling pressure and touched its lowest level of 2021 at 1.3341 on Tuesday. The technical picture doesn't point to a recovery in the near term and the pair will remain at the mercy of the dollar's valuation, which has been driven by US Treasury bond yields.
The benchmark 10-year US Treasury bond yield climbed to a monthly high near 1.7% on Tuesday and helped the greenback continue to outperform its rivals.
The US Dollar Index has stayed in a consolidation phase around mid-96.00s as investors await key data releases from the US. The US Bureau of Economic Analysis will publish the second estimate of the third-quarter GDP growth and the Personal Consumption Expenditure (PCE) Price Index for October. Markets expect core PCE inflation to rise to 4.1% on a yearly basis from 3.6% in September. A stronger-than-forecast print could pave the way for another leg up in yields and weigh on GBP/USD.
The FOMC will also release the minutes of its November meeting but investors are likely to ignore this publication ahead of the Thanksgiving break.
Meanwhile, Brexit headlines are having no noticeable impact on the British pound with sides looking to drag negotiations on the Northern Ireland protocol into the new year.
GBP/USD Technical Analysis
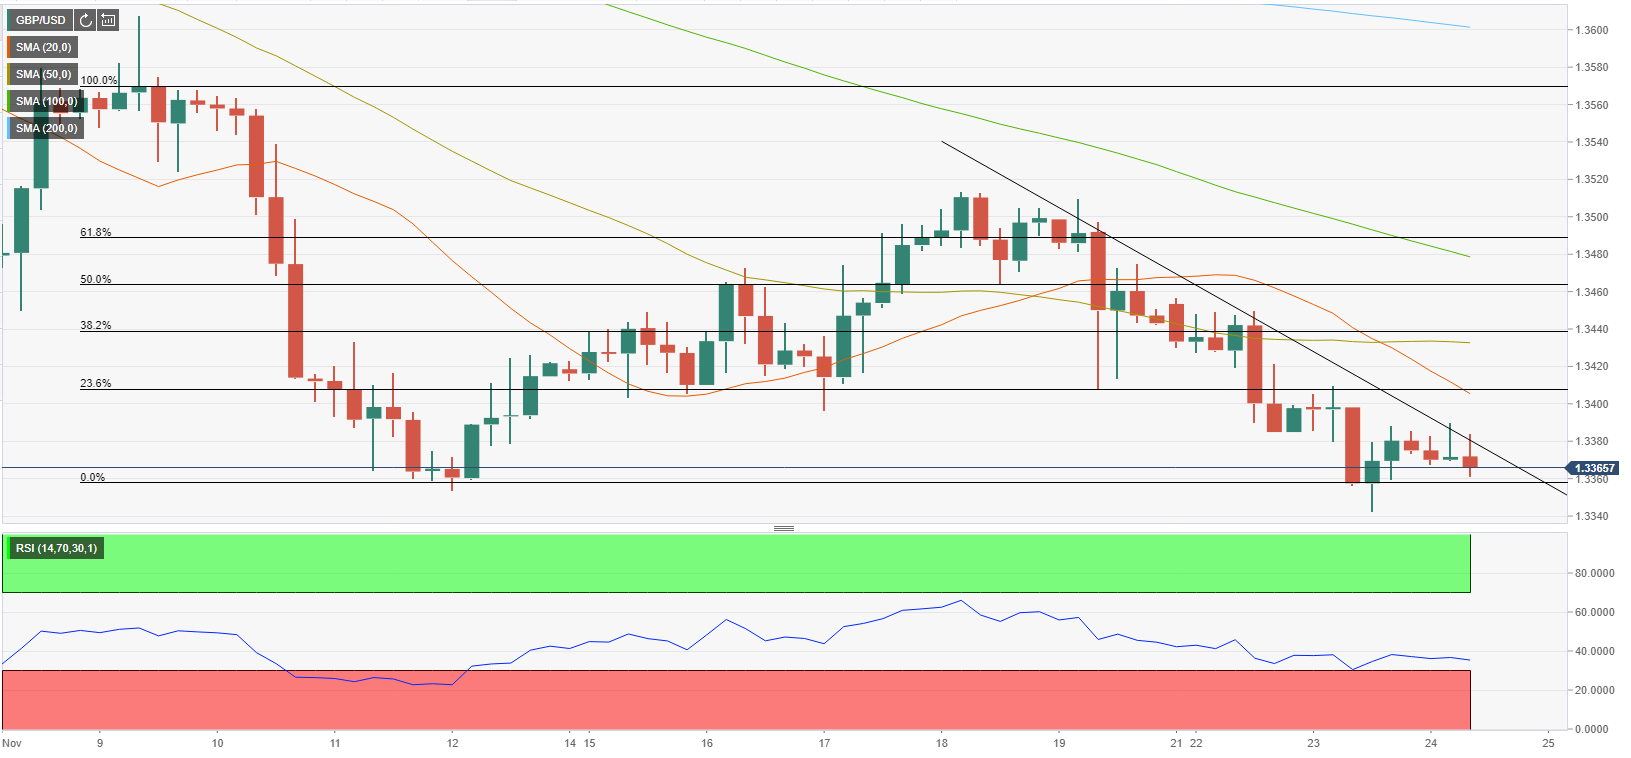
The Relative Strength Index on the four-hour chart has stayed above 30, suggesting that there is more room on the downside before the pair turns oversold. Additionally, GBP/USD continues to trade below the descending trend line coming from November 18, confirming the view that buyers are struggling to dominate the action.
In case a four-hour candle closes below the 1.3350/40 support area (static level, 2021-low), additional losses toward 1.3300 (psychological level) could be witnessed.
On the upside, 1.3380 (descending trendline) aligns as first resistance before 1.3400 (Fibonacci 23.6% retracement of the November 9-12 drop, psychological level, 20-period SMA) and 1.3440 (Fibonacci 38.2% retracement, 50-period SMA).
Information on these pages contains forward-looking statements that involve risks and uncertainties. Markets and instruments profiled on this page are for informational purposes only and should not in any way come across as a recommendation to buy or sell in these assets. You should do your own thorough research before making any investment decisions. FXStreet does not in any way guarantee that this information is free from mistakes, errors, or material misstatements. It also does not guarantee that this information is of a timely nature. Investing in Open Markets involves a great deal of risk, including the loss of all or a portion of your investment, as well as emotional distress. All risks, losses and costs associated with investing, including total loss of principal, are your responsibility. The views and opinions expressed in this article are those of the authors and do not necessarily reflect the official policy or position of FXStreet nor its advertisers. The author will not be held responsible for information that is found at the end of links posted on this page.
If not otherwise explicitly mentioned in the body of the article, at the time of writing, the author has no position in any stock mentioned in this article and no business relationship with any company mentioned. The author has not received compensation for writing this article, other than from FXStreet.
FXStreet and the author do not provide personalized recommendations. The author makes no representations as to the accuracy, completeness, or suitability of this information. FXStreet and the author will not be liable for any errors, omissions or any losses, injuries or damages arising from this information and its display or use. Errors and omissions excepted.
The author and FXStreet are not registered investment advisors and nothing in this article is intended to be investment advice.
Recommended Content
Editors’ Picks
USD/JPY flat-lines below 151.50 after soft Japanese CPI data
USD/JPY stays defensive below 151.50 after the release of a soft Japan's CPI report and mixed Industrial Production and Retail Sales data on Friday. Japanese verbal intervention also weighs on the pair amid the holiday-thinned conditions on Good Friday. US PCE inflation awaited.
AUD/USD buyers lack vigor above 0.6500 amid Good Friday trading lull
AUD/USD is trading listlessly above 0.6500 in the Asian session amid light trading on Good Friday. The Aussie pair shrugs off encouraging comments from China's FX regulator, as price action remains subdued ahead of the US PCE inflation data.
Gold flirts with record highs above $2,230, all eyes on US PCE data
Gold price flirts with record highs around $2,230 during the Asian session on Friday. The uptick of yellow metal is bolstered by the safe-haven flows amidst growing economic concerns and the prospect of interest rate cuts from the US Federal Reserve.
Optimism price could fall as nearly $90 million worth of OP tokens is due flood markets
Optimism volatility has shrunk in the ours leading to the network’s cliff unlock. It joins the likes of dYdX and Sui, which have similar events on their calendars. As token unlocks are often considered bearish catalysts, investors should brace for a reaction after the event.
Will they won’t they cut rates is the question of Q2?
There has been some significant push back from Fed and Bank of England members around the timing of rate cuts, and the Bank of Japan still haven’t physically intervened in the FX market to stem yen weakness although they are threatening to do so.