GBP/USD Forecast: Barnier’s no go for Brexit plan sends Sterling lower
- Sterling is trading at weekly lows after slumping 100 pips on Barnier’s no-go for Theresa May’s post-Brexit trade plan.
- GBP/USD is trading flat on a weekly basis before the US second-quarter GDP data are expected to show strong growth.
- The Bank of England is expected to hike rates next Thursday with division marking the Monetary Policy Committee (MPC) voting pattern.
Sterling is trading down 0.15% below 1.3100 level after the negative mood carried over from Thursday after EU chief negotiator Michel Barnier said the bloc refuses the UK latest proposal for post-Brexit trade setup, sending Sterling down 100 pips.
The news of the UK Prime Minister taking a firm grip over the Brexit negotiations nominating Domonic Raab for Brexit secretary saw Sterling rising to the highest level of above 1.3200 this week, but the failure of the best ideas to pass through poses a big question mark over the Brexit negotiations.
Brexit talks are set to resume in two weeks, but there are about six more weeks left for the negotiations before the final Brexit agreement is expected to be finished with time shortage pressing Sterling lower.
The Bank of England is scheduled to release the August Inflation Report along with the Monetary Policy Committee (MPC) meeting. While the central market expectation is for the MPC to raise the Bank rate to 0.75%, the voting pattern of the MPC members is likely to remain divided. Fundamentally, the Bank of England rate hike prospects anchor Sterling while Brexit uncertainties weigh.
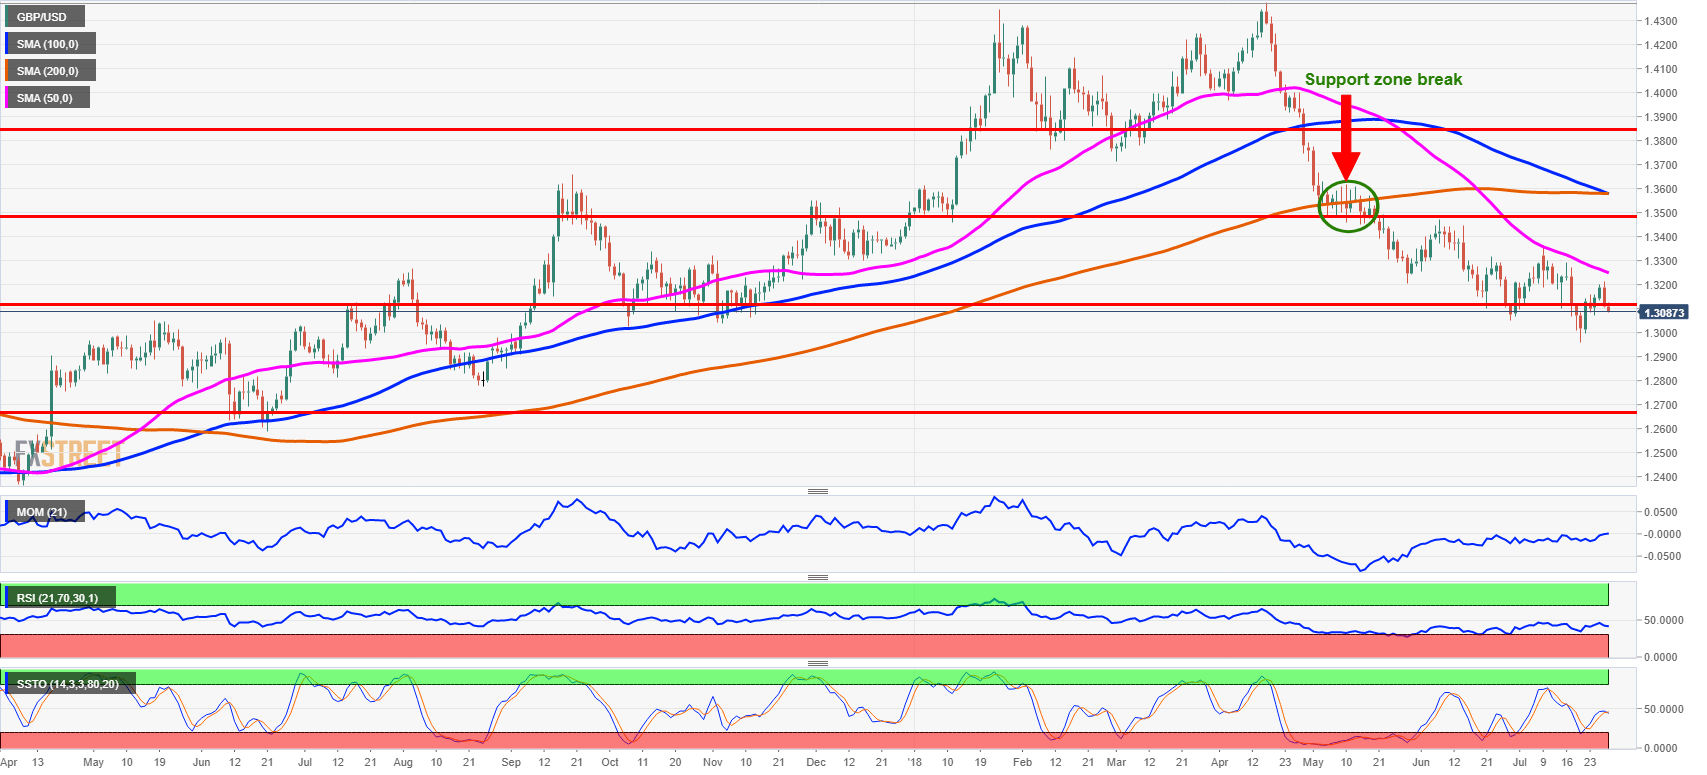
From the technical point of view, the GBP/USD just below 1.3100 representing the key support level and 38.2% Fibonacci retracement from post-Brexit slump from 1.5020 to 1.1940. Closing below that support is expected to open the target of psychologically important 1.3000 level before targeting 1.2670 representing 23.6% Fibonacci retracement of above mentioned post-Brexit slump lower. Ths is particularly imp0ortant as technical oscillators retreated to the neutral zones and are turning lower with Slow Stochastics making a bearish crossover.
GBP/USD daily chart
Author

Mario Blascak, PhD
Independent Analyst
Dr. Mário Blaščák worked in professional finance and banking for 15 years before moving to journalism. While working for Austrian and German banks, he specialized in covering markets and macroeconomics.


