GBP/USD Forecast: Back to Brexit reality as Powell's boost fades
- GBP/USD has been consolidating its gains as the dust settles from Powell's testimony.
- Brexit will likely return to the spotlight as the Conservative contest nears its end.
- Friday's technical four-hour chart shows GBP/USD is capped by a downtrend resistance line.

The "Powell Put" has probably run its course – and it is back to Brexit reality. Fed Chair Jerome Powell has concluded his lengthy testimonies on Capitol Hill by signaling the Fed will cut rates in July. In his second appearance on Wednesday, Powell expressed concern about a slowdown in investment among other topics.
The dollar – which fell sharply on Wednesday after the Fed Chair's first appearance – has recovered afterward. The primary driver has been the upbeat Core Consumer Price Index that beat expectations with a rise to 2.1% year on year in June. The rise in underlying inflation somewhat undermined Powell's fears that weak inflation may become persistent.
The greenback stabilization has also been underpinned by intensifying tensions between the US and China. President Donald Trump has claimed that China failed to fulfill its commitment to increase purchases of American agricultural products – as promised by Chinese President Xi Jinping. The world's largest economies continue talking but the recent spat has damped sentiment and boosted the safe-haven USD.
In the UK, there are some reports that Boris Johnson is firmly on the road to winning the Conservative Party's leadership contest. The Telegraph has said his lead over foreign secretary Jeremy Hunt looks "unassailable." The results are due on July 23rd unless Hunt steps down beforehand. Amber Rudd – one of the prominent pro-Remain ministers – has come out to support a no-deal Brexit. Her move has been described as a move to secure her spot in a Johnson government. Markets are concerned about a hard Brexit and Rudd's new position is unfavorable.
Bank of England member Gertjan Vlieghe has said that the BOE may cut interest rates in case of a hard Brexit and that the outlook has deteriorated in recent months – the words of Governor Mark Carney and adding to pressures on the pound.
Today's calendar features only the US Producer Price Index, leaving the scene to politics.
GBP/USD Technical Analysis – steep support lost
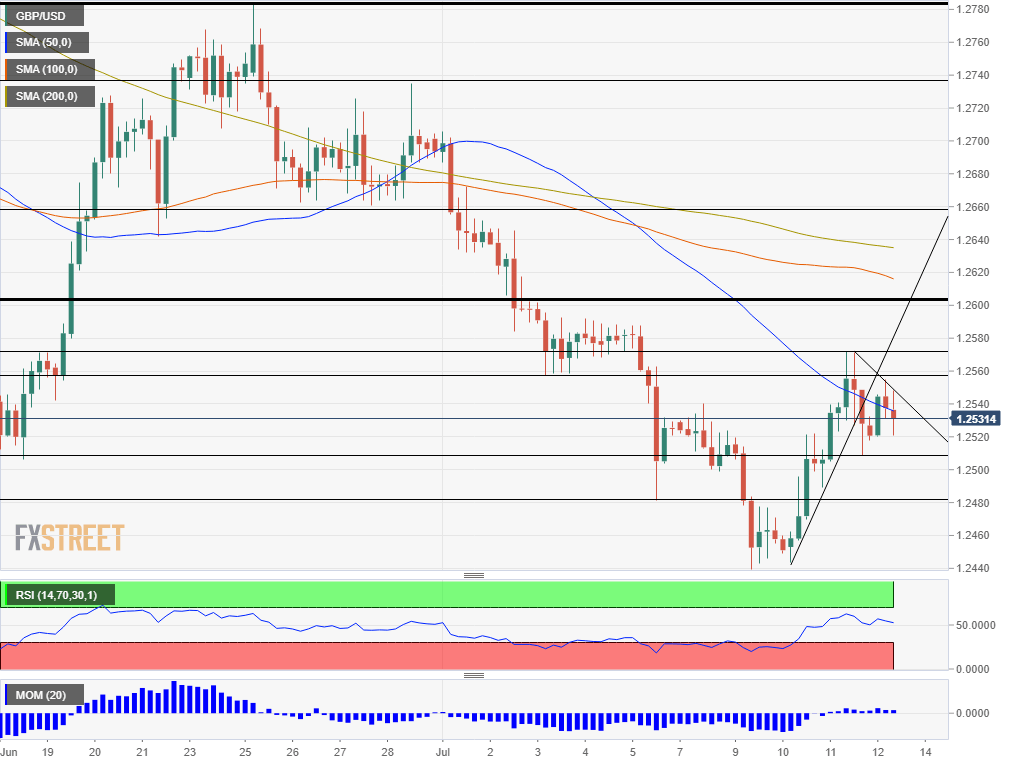
GBP/USD has been trading alongside a steep uptrend support line and lost it after the recent sideways trading. In turn, the chart has begun showing lower highs. The currency pair is struggling with the 50 Simple Moving Average and enjoys minimal upside momentum. The Relative Strength Index (RSI) is balanced at around 50.
Overall, the technical picture is mixed with a minor downside inclination.
Support awaits at 1.2505 which was June's low. Last week's swing low of 1.2480 is next, and 1.2439 is this week's low – and the lowest since January.
1.2560 provided support last week and also in May. It is followed by this week's high of 1.2575, and by 1.2605 which worked in both directions in the past few months. Next, we find 1.2660 and 1.2740.
Author

Yohay Elam
FXStreet
Yohay is in Forex since 2008 when he founded Forex Crunch, a blog crafted in his free time that turned into a fully-fledged currency website later sold to Finixio.


