GBP/USD Elliott Wave technical analysis [Video]
![GBP/USD Elliott Wave technical analysis [Video]](https://editorial.fxsstatic.com/images/i/GBPUSD-bearish-line.png)
GBPUSD Elliott Wave Analysis - Trading Lounge.
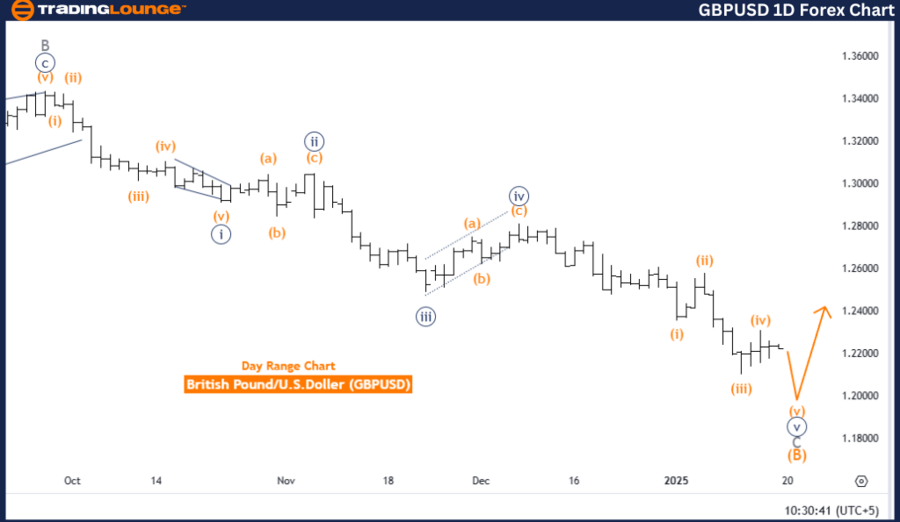
British Pound/ U.S. Dollar (GBPUSD) Day Chart.
GBP/USD Elliott Wave technical analysis
-
Function: Counter Trend.
-
Mode: Impulsive.
-
Structure: Orange wave 5.
-
Position: Navy Blue Wave 5 of C.
-
Direction (Next higher degrees): Navy blue wave 1 (New bullish trend).
Details
The GBPUSD daily chart reflects a counter-trend phase based on Elliott Wave Analysis. The current wave configuration exhibits an impulsive structure, focusing on orange wave five, which is part of a broader corrective sequence. This phase represents navy blue wave five of C, the concluding segment of the ongoing correction.
Orange wave four appears completed, allowing orange wave five to unfold. This wave signifies the final stage of the corrective cycle. Upon the conclusion of orange wave five and navy blue wave C, the market is projected to transition into a new bullish trend, heralded by navy blue wave one at a higher degree.
A critical invalidation level is identified at 1.23089. If the price descends below this threshold, the current wave structure will be invalidated, necessitating a reassessment of the Elliott Wave scenario. This invalidation level serves as a pivotal point for confirming the progression of the wave pattern.
Summary
The GBPUSD daily chart emphasizes the progression of orange wave five within the impulsive counter-trend movement. The completion of orange wave four has set the stage for the final leg of the corrective cycle, with navy blue wave five of C currently unfolding. Once this phase concludes, the market is expected to initiate a new bullish trend, beginning with navy blue wave one.
Maintaining the price above the invalidation level of 1.23089 is crucial to validate the current wave structure and align with the anticipated bullish transition. The analysis highlights the importance of tracking orange wave five’s progress and the invalidation threshold to confirm the expected trend reversal.
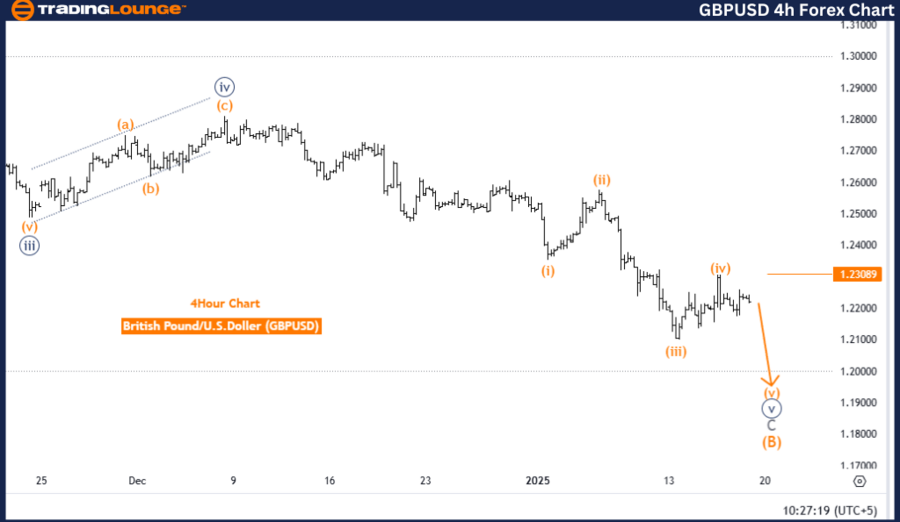
British Pound/ U.S. Dollar (GBPUSD) 4-Hour Chart.
GBP/USD Elliott Wave technical analysis
-
Function: Counter Trend.
-
Mode: Impulsive.
-
Structure: Orange wave 5.
-
Position: Navy Blue Wave 5 of C.
-
Direction (Next higher degrees): Orange wave 1 (New bullish trend).
Details
The GBPUSD four-hour chart reveals a counter-trend phase based on Elliott Wave Analysis. The ongoing wave sequence is impulsive, with a focus on orange wave five, which is part of a larger corrective structure. This phase aligns with navy blue wave five of C, signifying the final stage of the corrective cycle.
With the completion of orange wave four, the foundation is set for orange wave five to develop. This wave is a critical point in the current counter-trend phase, representing the culmination of the corrective structure. Upon the completion of orange wave five and navy blue wave C, the market is expected to transition into a new bullish trend, starting with orange wave one at a higher degree.
A significant invalidation level is noted at 1.23089. If the price drops below this level, the current wave pattern will no longer be valid, requiring a reassessment of the Elliott Wave framework. This threshold is essential for verifying the continuity of the wave progression.
Summary
The GBPUSD four-hour chart underscores the ongoing impulsive counter-trend movement, with orange wave five actively forming as navy blue wave five of C. The conclusion of orange wave four has set the stage for the final wave of the corrective phase, paving the way for a potential new bullish trend driven by orange wave one.
The invalidation level of 1.23089 is a key reference point to ensure the validity of the wave structure and the anticipated market transition. The analysis emphasizes tracking the progress of orange wave five while maintaining the price above the invalidation threshold to confirm alignment with the projected bullish outlook.
GBP/USD Elliott Wave technical analysis [Video]
Author

Peter Mathers
TradingLounge
Peter Mathers started actively trading in 1982. He began his career at Hoei and Shoin, a Japanese futures trading company.


