|

GBP/USD Elliott Wave: Chopping lower in temporary decline

Executive summary

  • GBP/USD finished the first wave of a larger third wave.
  • Current decline is viewed as wave (ii) of ((i)) of 3.
  • The forecast is bullish while holding above 1.3010.

Back on November 13, while trading at 1.3190, we forecasted a major low and large rally for GBP/USD that may extend to 1.48. Cable, so far, has reached a high of 1.3567 and the pattern we are following appears incomplete.

GBP/USD Elliott Wave count

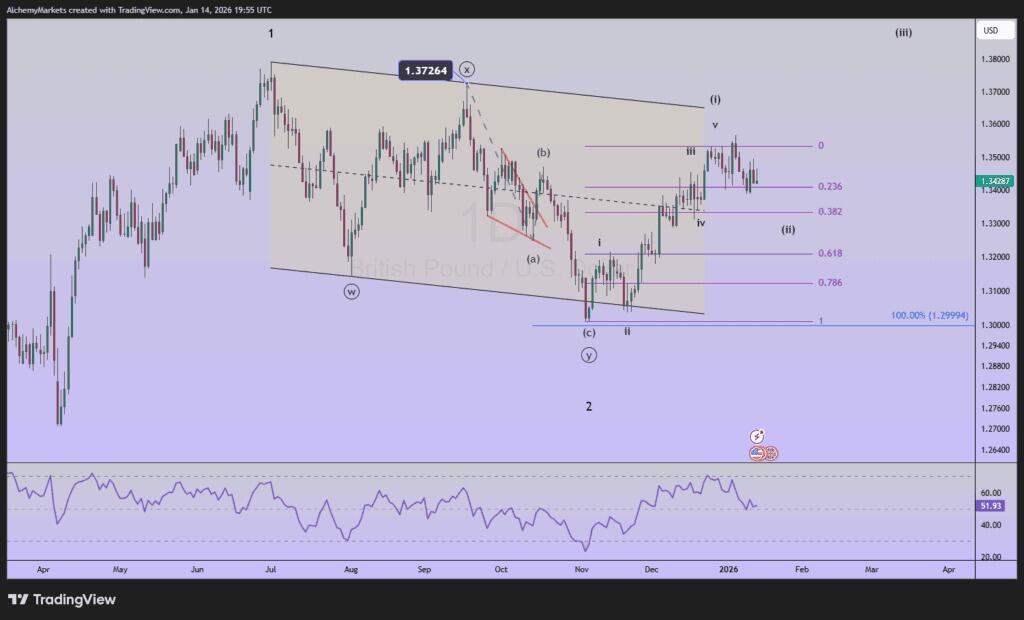
GBP/USD appears to have completed wave 2 at the 1.3010 low on November 5. We know from our Elliott wave studies that this suggests a wave 3 rally. Wave 3 tends to have a similar size or Fibonacci proportions to the wave 1, or 2025 rally.

Using the Fibonacci extension tool, this projects a 100% wave 3 rally at 1.48.

But first, GBP/USD appears to be correcting lower within a smaller degree wave (ii). This wave (ii) decline has met the minimum expectations at the 23.6% Fibonacci retracement level. However, more commonly, wave (ii) tends to retrace between 38.2% and 78.6%. This would yield a lower decline to 1.3125 – 1.3333.

Then, once wave (ii) is in place, GBP/USD would need to break above the price channel resistance near 1.3650.

Bottom line

GBP/USD appears to be correcting lower in a smaller degree wave (ii). We suspect this decline may halt near 1.3125 – 1.3333 and lead to a large wave 3 rally that possibly reaches 1.48.

If the 1.3010 support low is broken, then wave ‘2’ is extending lower.

Author

Zorrays Junaid

Zorrays Junaid

Alchemy Markets

Zorrays Junaid has extensive combined experience in the financial markets as a portfolio manager and trading coach. More recently, he is an Analyst with Alchemy Markets, and has contributed to DailyFX and Elliott Wave Forecast in the past.

More from Zorrays Junaid
Share:

Editor's Picks

AUD/USD falls to near 0.7100 after slipping below 50-day EMA

AUD/USD depreciates after registering minor gains in the previous day, trading around 0.7120 during the Asian hours. The technical analysis of the daily chart shows the pair consolidating sideways within a rectangle pattern, as neither bulls nor bears gain control. The AUD/USD pair is holding a slight bearish tone however as it sits beneath both the nine-day and 50-day EMAs.

160.00: USD/JPY back near intervention territory after upbeat US jobs report

US Nonfarm Payrolls beat expectations by a wide margin in May, with 172K jobs added. The US Dollar rebounds after the release, helping USD/JPY recover from its intraday lows. Warnings from Japanese authorities continue to limit upside potential near the 160.00 threshold.

Gold targets $4,300 amid stronger Dollar

Gold faces increasing selling interest and navigates the area of three-month lows near the $4,300 mark per troy ounce on Friday. The precious metal’s decline comes as traders assess the stronger-than-expected NFP, while the bid bias in the Greenback and higher US Treasury yields also collaborate with the retracement.

Cardano hits five-year low even as Hoskinson clarifies "break" isn't an exit

Cardano (ADA) price is down 10% at press time on Friday, extending losses over 30% so far this week amid Charles Hoskinson's clarification that "break" isn't an exit.

Week ahead – Fed countdown begins amid US inflation data and geopolitical risks

Fed Chair Warsh’s first meeting approaches as key US inflation data could reshape expectations. Oil prices remain elevated as US-Iran talks continue; tariffs also return to the spotlight. ECB is expected to hike; will it be a one-off move or is July live?

The US economy defies the rules: 100 days into the Oil shock and the recession signal is still missing

More than three months after the start of the Iran war and the resulting disruption to global energy markets, the US economy continues to display remarkable resilience. The conflict has triggered a sharp rise in Oil prices, reignited inflationary pressures and fueled widespread concerns about a potential economic slowdown.