GBP/USD Elliott Wave analysis [Video]
![GBP/USD Elliott Wave analysis [Video]](https://editorial.fxsstatic.com/images/i/GBPUSD-neutral-object-1.png)
GBP/USD Elliott Wave analysis
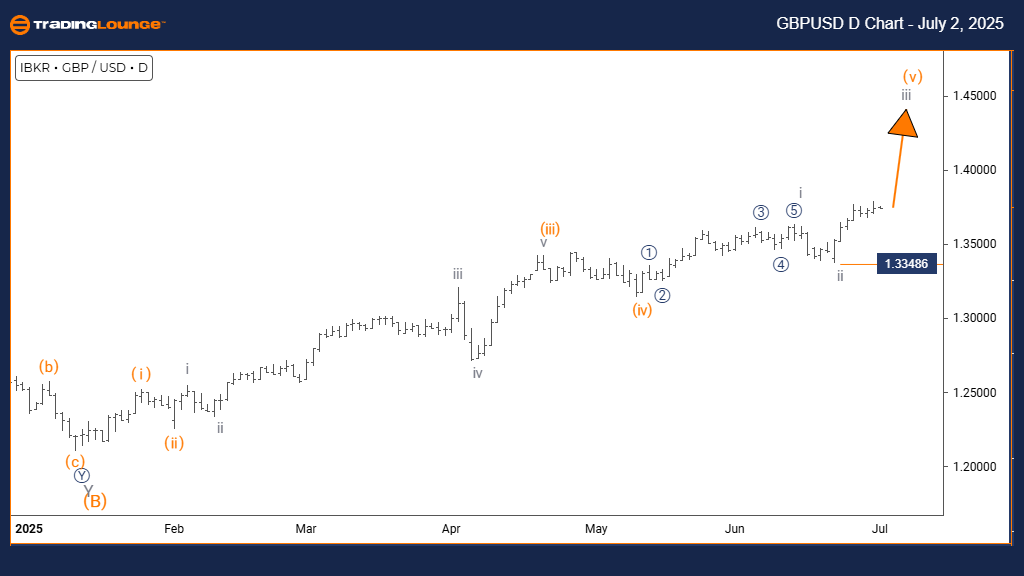
Function: Bullish Trend.
Mode: Impulsive.
Structure: Gray Wave 3.
Position: Orange Wave 5.
Next higher degree direction: Gray Wave 3 (Active)
Details: Gray Wave 2 is likely complete. Gray Wave 3 is now in progress.
Wave cancel invalidation level: 1.33486
The Elliott Wave analysis for GBPUSD on the daily chart indicates a bullish market setup. The pair is displaying impulsive behavior, pointing to strong upward momentum. The current wave count marks Gray Wave 3 within Orange Wave 5, suggesting a dynamic segment of the bullish structure where third waves are known for powerful price action.
Gray Wave 2 appears to have completed its corrective phase, giving way to Gray Wave 3. This segment usually carries extended upward moves with minimal pullbacks. As Gray Wave 3 unfolds within the broader Orange Wave 5, traders can expect potential sustained gains.
The critical level to watch is 1.33486. Any move below this level would invalidate the current wave count and require a revised interpretation. As long as this level holds, the outlook remains upward.
Technical indicators support the view of institutional buying, with the ongoing wave expected to drive notable gains as part of the bullish cycle.
GBP/USD Elliott Wave analysis
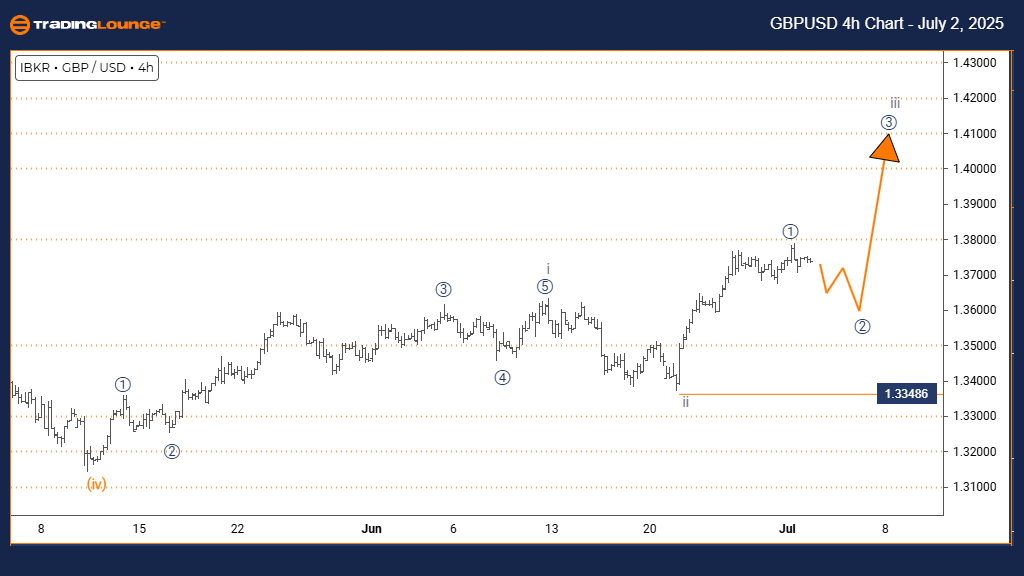
Function: Counter Trend.
Mode: Corrective.
Structure: Micro Navy Blue Wave 2.
Position: Gray Wave 3.
Next higher degree direction: Micro Navy Blue Wave 3.
Details: Micro Navy Blue Wave 1 seems complete. Micro Navy Blue Wave 2 is underway.
Wave cancel invalidation level: 1.33486.
On the 4-hour chart, GBPUSD is in a counter-trend phase. The pair is undergoing a corrective move represented by Micro Navy Blue Wave 2 within the broader Gray Wave 3. This indicates a temporary pullback as part of a larger bullish trend.
Micro Navy Blue Wave 1 appears to have ended, and the market is currently forming Micro Navy Blue Wave 2. This corrective stage is expected to retrace some of Wave 1’s gains. Once complete, Micro Navy Blue Wave 3 may begin, potentially resuming the dominant bullish direction.
The corrective structure implies range-bound trading or modest declines in the short term. Still, the overall Gray Wave 3 positioning signals continued upward potential after this brief pullback concludes.
Traders should watch for signs that Micro Navy Blue Wave 2 is ending, as this will likely signal the beginning of a new upward move in Micro Navy Blue Wave 3.
GBP/USD Elliott Wave analysis [Video]
Author

Peter Mathers
TradingLounge
Peter Mathers started actively trading in 1982. He began his career at Hoei and Shoin, a Japanese futures trading company.


