GBP/USD continues to navigate deeper waters

For those who read the previous technical view I posted on the GBP/USD currency pair, price action has indeed continued to pursue lower levels.
Short-term price action sub $1.24
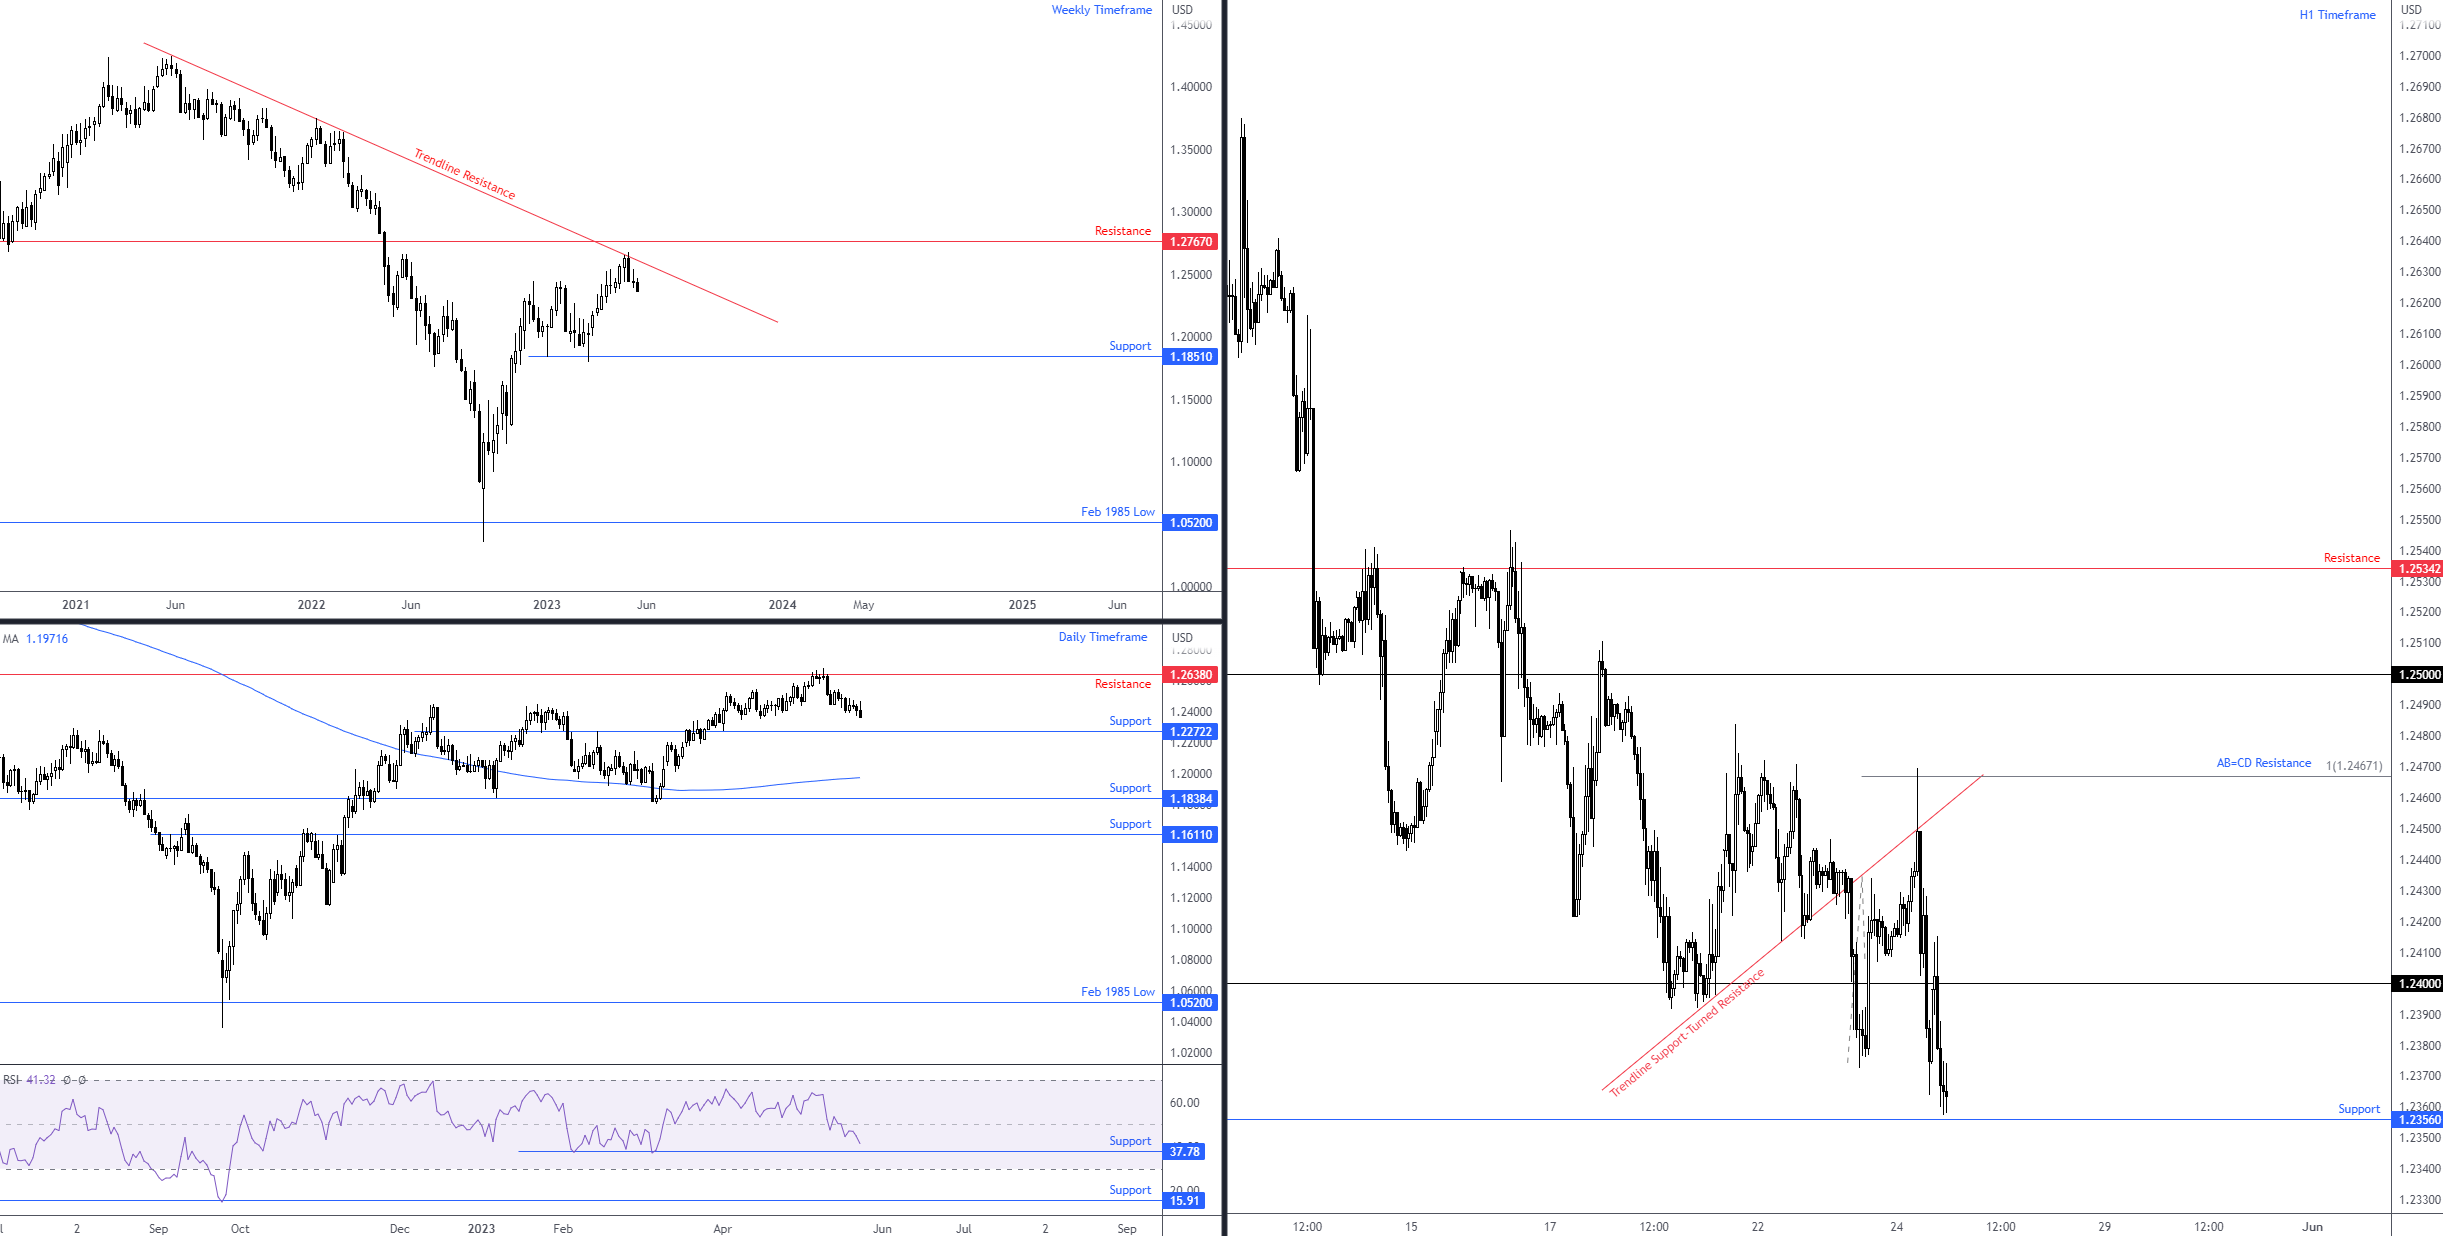
Despite efforts to shape support from the $1.24 region, recent hours witnessed price elbow beneath the psychological level. This followed a near-pip-perfect H1 AB=CD harmonic bearish formation taking form at $1.2467 (denoted by a 100% projection ratio), a base that was bolstered by a H1 trendline support-turned-resistance taken from the low $1.2392. Downside support can be seen nearby at $1.2356, with a break paving the way for follow-through selling towards $1.23.
View from higher timeframes show scope for further downside
The bigger picture continues to put forth a bearish bias. The weekly timeframe recently tested a major long-term trendline resistance drawn from the high of $1.4250, placing weekly support at $1.1851 in view as a potential long-term support target.
Aiding the weekly timeframe’s resistance, an additional layer of resistance made its way into the frame at $1.2638 on the daily chart in mid-May. This has positioned daily support at $1.2272 on the radar and pulled the Relative Strength Index (RSI) south of the 50.00 centreline towards indicator support at 37.78.
GBP/USD direction
Given the scope to post additional underperformance, GBP/USD is likely to cross beneath H1 support from $1.2356 and target $1.23, followed by daily support mentioned above at $1.2272. A H1 close lower, therefore, could ignite breakout selling.
Author

Aaron Hill
FP Markets
After completing his Bachelor’s degree in English and Creative Writing in the UK, and subsequently spending a handful of years teaching English as a foreign language teacher around Asia, Aaron was introduced to financial trading,


