|

GBP/USD collapsed below significant support clusters and few cushions below — Confluence Detector

The Technical Confluences Indicator shows that on its way down, the GBP/USD broke below several important clusters of technical support lines. And at current levels under $1.4200,  there are very few support lines to the downside. It was triggered by weak inflation.

The pair tumbled nearly 100 pips and took down a dense confluence of levels around $1.4270: the SMA100-1h, the SMA10-15, the Bolinger Band 1h-Lower, the 1h low, the 4h-high, and the Pivot Point one-month R1.It also dropped below important support around $1.4217 where we see a congestion of the Fibonacci 28.2% one-week, the BB 1h-Lower, the SMA50-4h, and the SMA200-1h. 

Both these clusters now turn into resistance.

And where can the pair find support? At around $1.4150, we find the Pivot Point one-day S1, the Fibonacci 61.8% one-week, and the SMA10-one-day. 

Another level of support is at $1.4114, which consists of the Fibonacci 23.6% one-month and the Pivot Point one-week S1. These are not such strong lines and a drop to the one-week low at $1.4070 cannot be ruled out.

Here is how it looks:
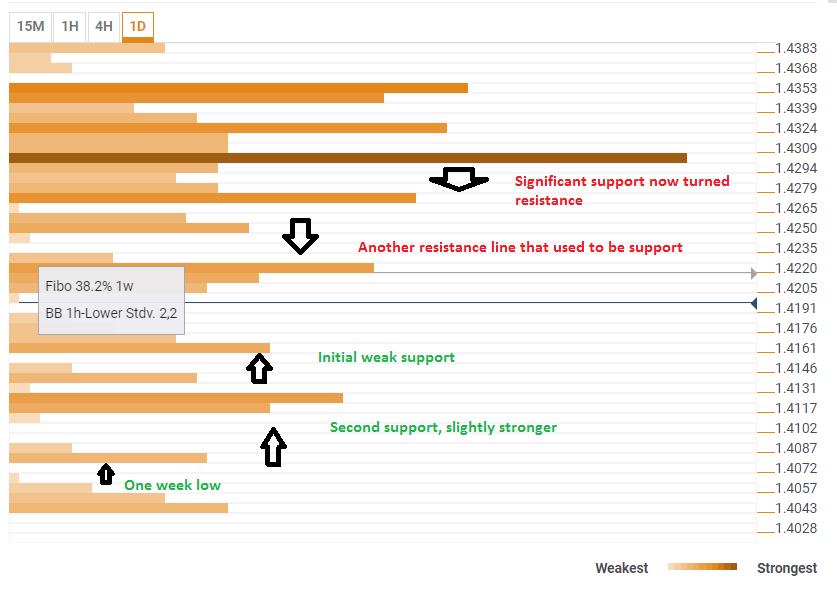
 
GBP USD confluence lines after the big fall

Confluence Detector

The Confluence Detector finds interesting opportunities using Technical Confluences. The TC is a tool to locate and point out those price levels where there is a congestion of indicators, moving averages, Fibonacci levels, Pivot Points, etc. Knowing where these congestion points are located is very useful for the trader, and can be used as a basis for different strategies.

This tool assigns a certain amount of “weight” to each indicator, and this “weight” can influence adjacents price levels. This means that one price level without any indicator or moving average but under the influence of two “strongly weighted” levels accumulate more resistance than their neighbors. In these cases, the tool signals resistance in apparently empty areas.

Learn more about Technical Confluences

Author

Yohay Elam

Yohay Elam

FXStreet

Yohay is in Forex since 2008 when he founded Forex Crunch, a blog crafted in his free time that turned into a fully-fledged currency website later sold to Finixio.


More from Yohay Elam
Share:

Editor's Picks

AUD/USD holds above 0.6950 as bullish USD caps gains

AUD/USD edges lower during the Asian session on Tuesday, stalling a two-day recovery move from a two-month low, touched last week. An extended rout in the fixed income market keeps US bond yields elevated near multi-year highs. This, along with geopolitical uncertainties, helps the US Dollar retain its bullish tone despite receding October Fed hike bets. However, expectations for another RBA rate hike this month could act as a tailwind for the Aussie.

USD/JPY rises back above 158.00 despite hawkish BoJ outlook

USD/JPY rises back above 158.00 in the early European morning on Tuesday. The pair strengthens as the Japanese Yen fails to find any inspiration from hawkish BoJ expectations and looming intervention risks. Meanwhile, geopolitical uncertainty and elevated US bond yields keep the US Dollar near its YTD high despite receding October Fed hike bets. This, in turn, helps the pair stay supported.

Gold stays firm; looks at $4,200

Gold builds on Monday’s marginal bounce, although it struggles to reclaim the key $4,200 mark per troy ounce so far on Tuesday. The yellow metal’s advance comes on the back of the fresh downside momentum in the US Dollar in tandem with retreating US Treasury yields across the curve.

Crypto Today: Bitcoin, Ethereum, XRP bulls battle to restart uptrend amid ETF outflows

Bitcoin upholds a robust bullish outlook, trading at $85,837 on Tuesday as sellers push to regain control over the trend. Altcoins, meanwhile, reflect Bitcoin’s ranging action, with Ethereum trading sideways above $2,700 and Ripple hovering around the pivotal $1.50 level.

Japanese Yen nears 158.00: Two analysts agree it's bullish, and disagree on how far the breakout goes

The JPY is drifting near 158.00 against the USD ahead of a busy week of Japanese data and a still-unclear BoJ timetable. The two most recent FXStreet analyses agree on the direction, but they disagree on the target and the mechanism.

Eurozone inflation just hit 3.8%, its highest in three years. This chart shows why the ECB can’t simply hike its way out

The ECB would normally have a relatively straightforward answer to inflation running almost twice its target: raise interest rates. But these are not normal circumstances. This time, the bond market is already doing part of the tightening for it, leaving the ECB facing an increasingly difficult dilemma.















