GBP/USD Challenges 1.27 Resistance Zone but Fails to Break

The GBP/USD is challenging the resistance trend lines but so far has failed to make a break. A bearish bounce however could confirm the wave4 (green) pattern in the chart.
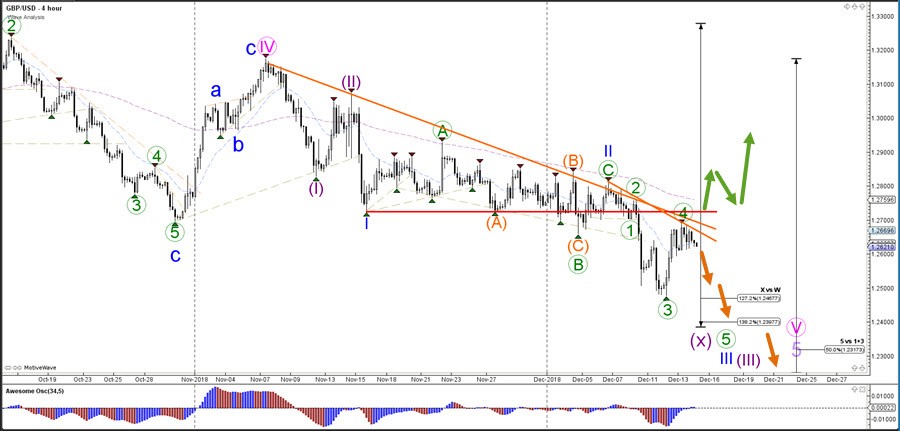
GBP/USD
4 hour
The GBP/USD is at a key decision zone for a bullish break or bearish bounce. Price is either building an expanded WXY (purple) correction or a full downtrend. The key level is the 138.2% Fibonaccilevel. A bearish break indicates a downtrend whereas a bullish break above the resistance trend lines indicates a larger correction.
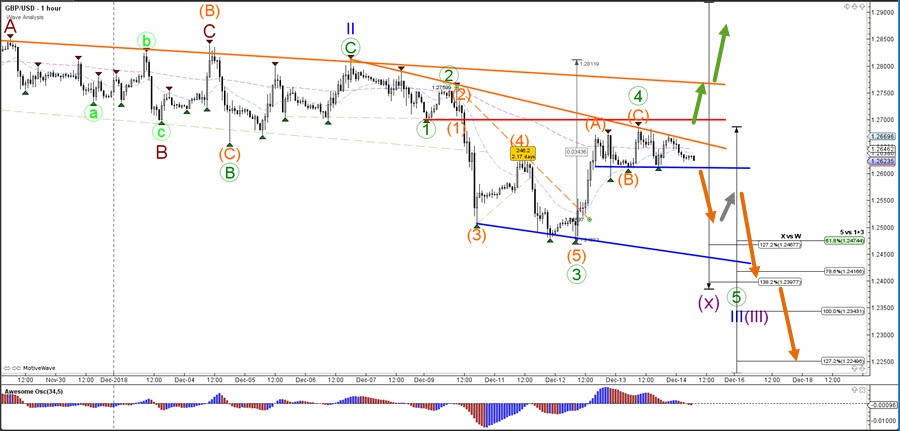
1 hour
The GBP/USD could have completed a bullish ABC (orange) within wave 4 (green) but the price action is volatile due the Brexit news. The GBP/USD needs to break the neck line (blue) before a bearish breakout is possible.
Author

Chris Svorcik
Elite CurrenSea
Experience Chris Svorcik has co-founded Elite CurrenSea in 2014 together with Nenad Kerkez, aka Tarantula FX. Chris is a technical analyst, wave analyst, trader, writer, educator, webinar speaker, and seminar speaker of the financial markets.


