GBP/USD attempts to recoup some losses [Video]
-
GBP/USD maintains weak bias in near term.
-
Falls from 4-month high.
-
MACD and RSI suggest horizontal move.
![GBP/USD attempts to recoup some losses [Video]](https://editorial.fxstreet.com/images/Markets/Currencies/Majors/GBPUSD/iStock-472155766_XtraLarge.jpg)
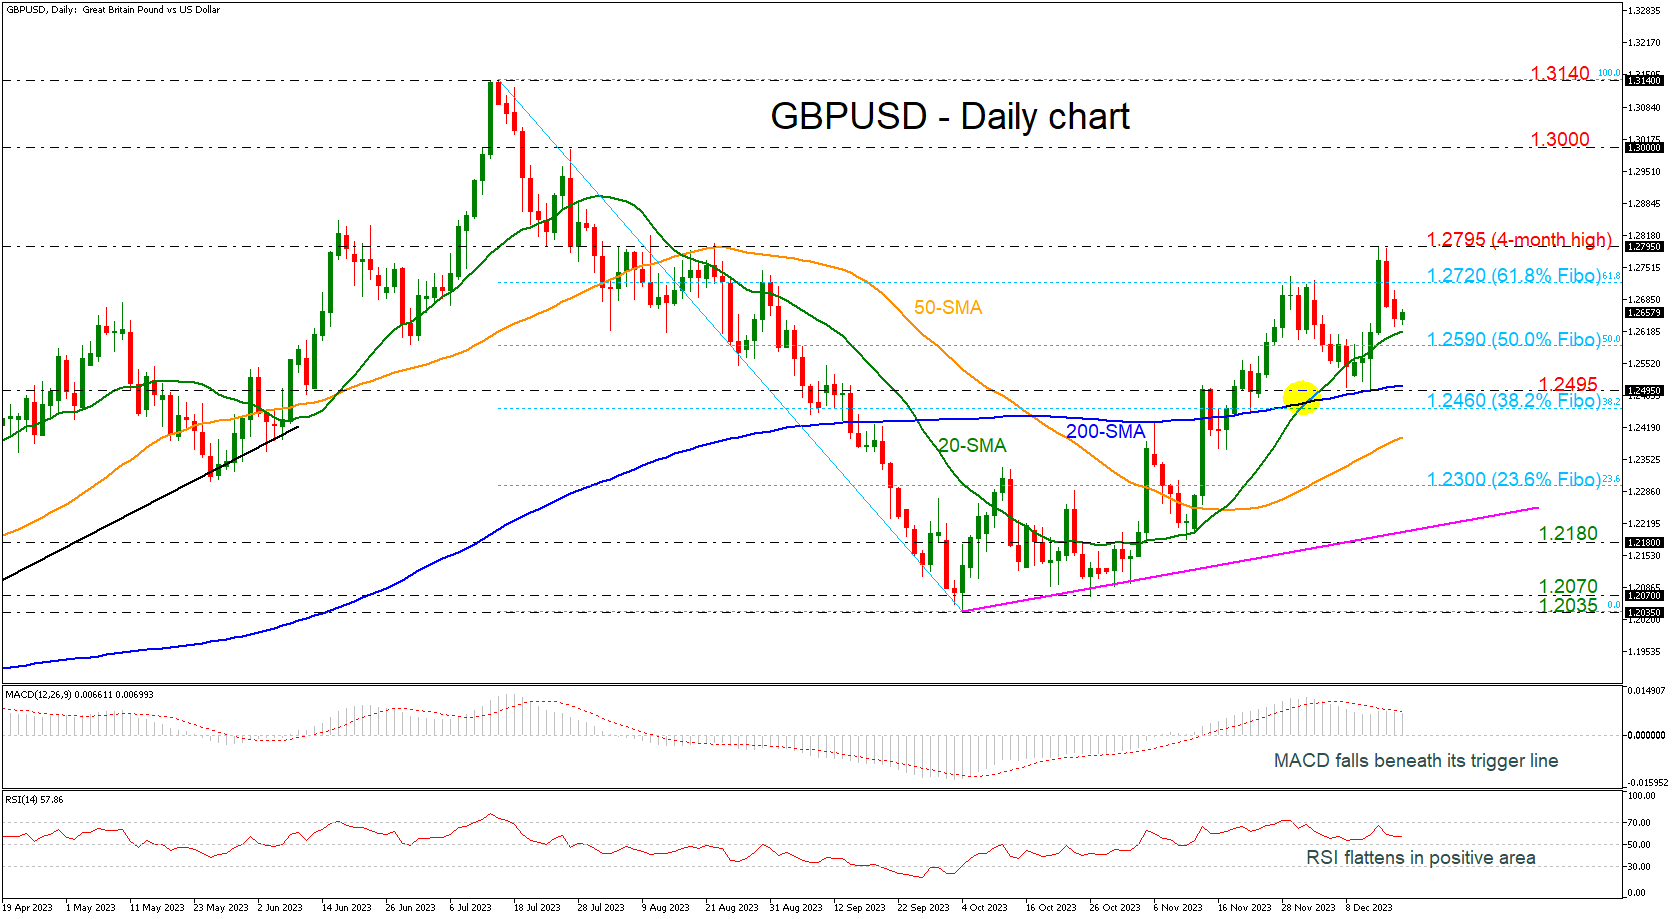
GBPUSD climbed to a new four-month high in the previous week, but it reversed lower again, falling beneath the 61.8% Fibonacci retracement level of the down leg from 1.3140 to 1.2035 at 1.2720.
The next major support level for traders to have in mind is the 20-day simple moving average (SMA) at 1.2615, with the technical oscillators confirming another bearish wave. The MACD oscillator is falling beneath its trigger line in the positive territory, while the RSI is flattening above the 50 level.
If price action remains above the 50.0% Fibonacci of 1.2590, there is scope to test the 61.8% Fibonacci of 1.2720. Clearing this key level would see additional gains towards the four-month peak of 1.2795. This is considered to be a strong resistance area which has been rejected a few times in the past. Rising above it could see prices re-test the 1.3000 round number, taken from the peak on July 27.
If 1.2590 support fails, then the focus would shift to the downside towards 1.2495, which overlaps with the 200-day SMA. If breached, that would increase downside pressure, and perhaps bring about a reversal until the 38.2% Fibonacci of 1.2460 and the 50-day SMA at 1.2400. From here, GBPUSD would be on the path towards the 23.6% Fibonacci of 1.2300 ahead of the short-term ascending trend line at 1.2200.
Overall, GBPUSD has been bullish since bottoming at 1.2035. However, near-term weakness is expected to remain as long as technical oscillators are still losing some steam.
Author

Melina joined XM in December 2017 as an Investment Analyst in the Research department. She can clearly communicate market action, particularly technical and chart pattern setups.


