GBP/USD ABC Pattern Indicates Bullish Targets at 1.3250-1.33

The GBP/USD bullish breakout was strong but price action is now slowing down. What could be expected with the next price swing?
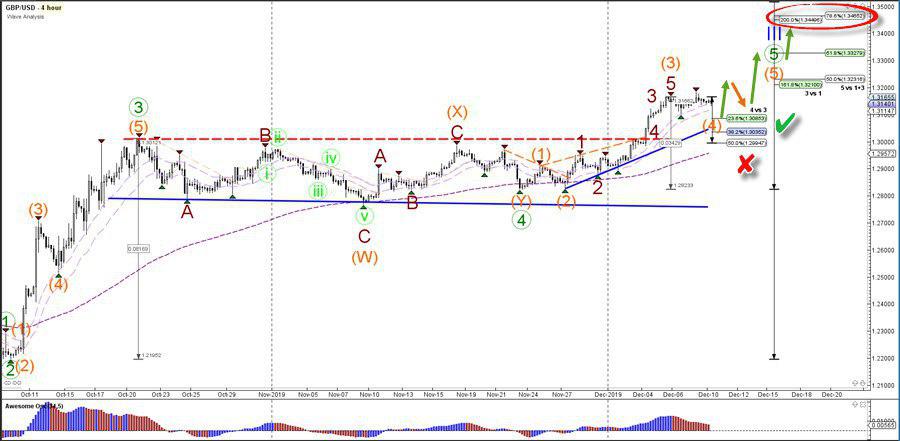
GBP/USD
4 hour
The GBP/USD breakout could be a wave 3 (orange) impulse, which means that a corrective and shallow wave 4 (orange) pullback is expected. In this case, the usual support levels are the 23.6% and 38.2% Fibonacci retracements. A bullish bounce could confirm (green check) the continuation higher towards the Fibonacci targets of wave 3 vs 1 and wave 5 vs 1+3. An unexpected break below the 50% Fib makes a wave 4 less likely (red x).
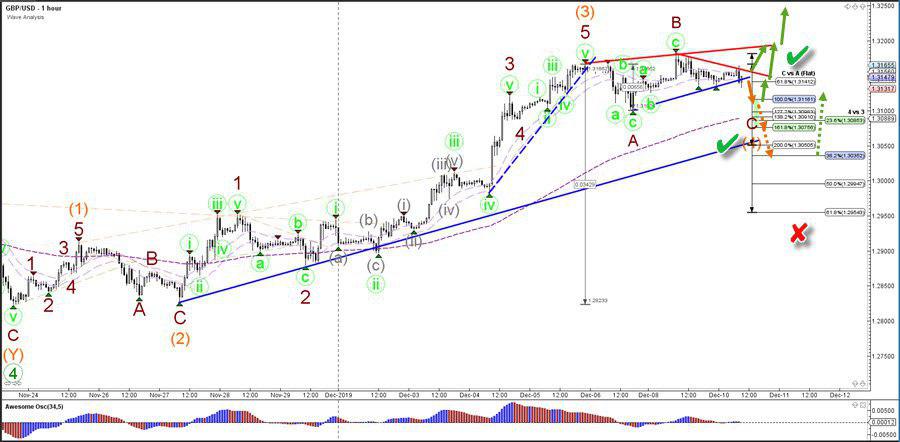
1 hour
The GBP/USD is showing a potential ABC (dark red) correction within wave 4 (orange). A bullish bounce (green check) at the Fibonacci levels and breakout above the resistance trend line (red) could confirm (green checks) the end of the wave 4 and the start of a bullish trend. Price is not expected to break below the 50-61.8% Fibs at 1.2950-1.30 otherwise the wave outlook needs to be changed (red x).
The analysis has been done with the CAMMACD.MTF template.
For more daily technical and wave analysis and updates, sign-up up to our ecs.LIVE channel.
Author

Chris Svorcik
Elite CurrenSea
Experience Chris Svorcik has co-founded Elite CurrenSea in 2014 together with Nenad Kerkez, aka Tarantula FX. Chris is a technical analyst, wave analyst, trader, writer, educator, webinar speaker, and seminar speaker of the financial markets.


