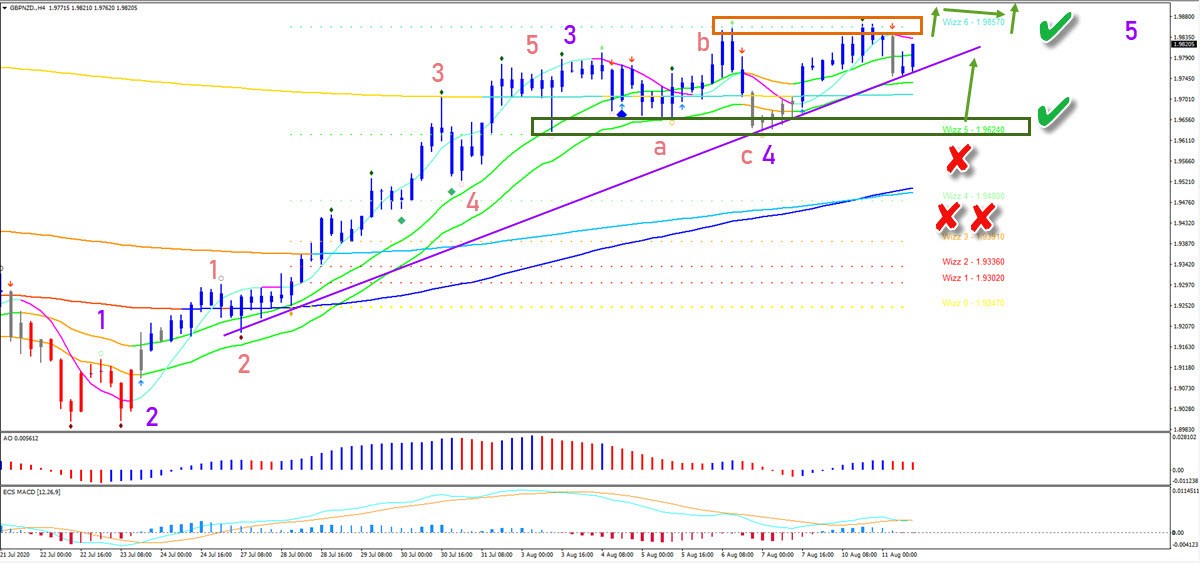
GBP/NZD ascending wedge pattern favours bull breakout


The GBP/NZD made a double top pattern… but the bulls seem ready to smash through the resistance and continue with the uptrend.
Price Charts and Technical Analysis
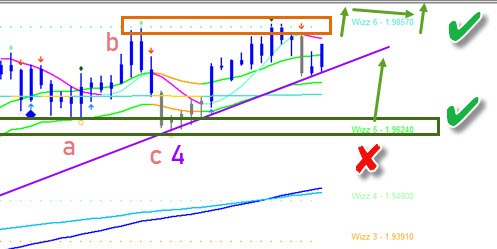
The GBP/NZD retested the 21 ema support zone after reaching the wizz 6 target. But price action made a clear bounce and retested the Wizz 6 zone again. Although the GN failed to break the resistance zone, the bulls are buying at higher support levels (purple line). This indicates that the buying pressure will probably overcome the resistance at the double top (green arrows), which also looks like an ascending wedge chart pattern.
The GBP/NZD remains bullish as long as price stays above the Wizz 5 support zone. In that case, a wave 4 (purple) still remains likely. But a break below the support makes the bullish outlook unlikely (red x), especially if price breaks below the 144 ema (2x red x).
The analysis has been done with the ecs.SWAT method and ebook.
Author

Chris Svorcik
Elite CurrenSea
Experience Chris Svorcik has co-founded Elite CurrenSea in 2014 together with Nenad Kerkez, aka Tarantula FX. Chris is a technical analyst, wave analyst, trader, writer, educator, webinar speaker, and seminar speaker of the financial markets.


