GBP/JPY Reached The Extreme Area Lower And Bounced

Hello fellow traders. In this technical blog we’re going to take a quick look at the Elliott Wave charts of GBPJPY, published in members area of the website. As our members know, the pair had incomplete bearish sequence in the cycle from the January 28th peak. The Elliott wave structure had been calling for further weakness. Consequently, we advised members to avoid buying the pair and keep on favouring the short side, selling the rallies in the sequences of 3,7,or 11 swings whenever opportunity presented itself. In further text we’re going to explain how we called the pair lower and look at the Elliott wave structure.
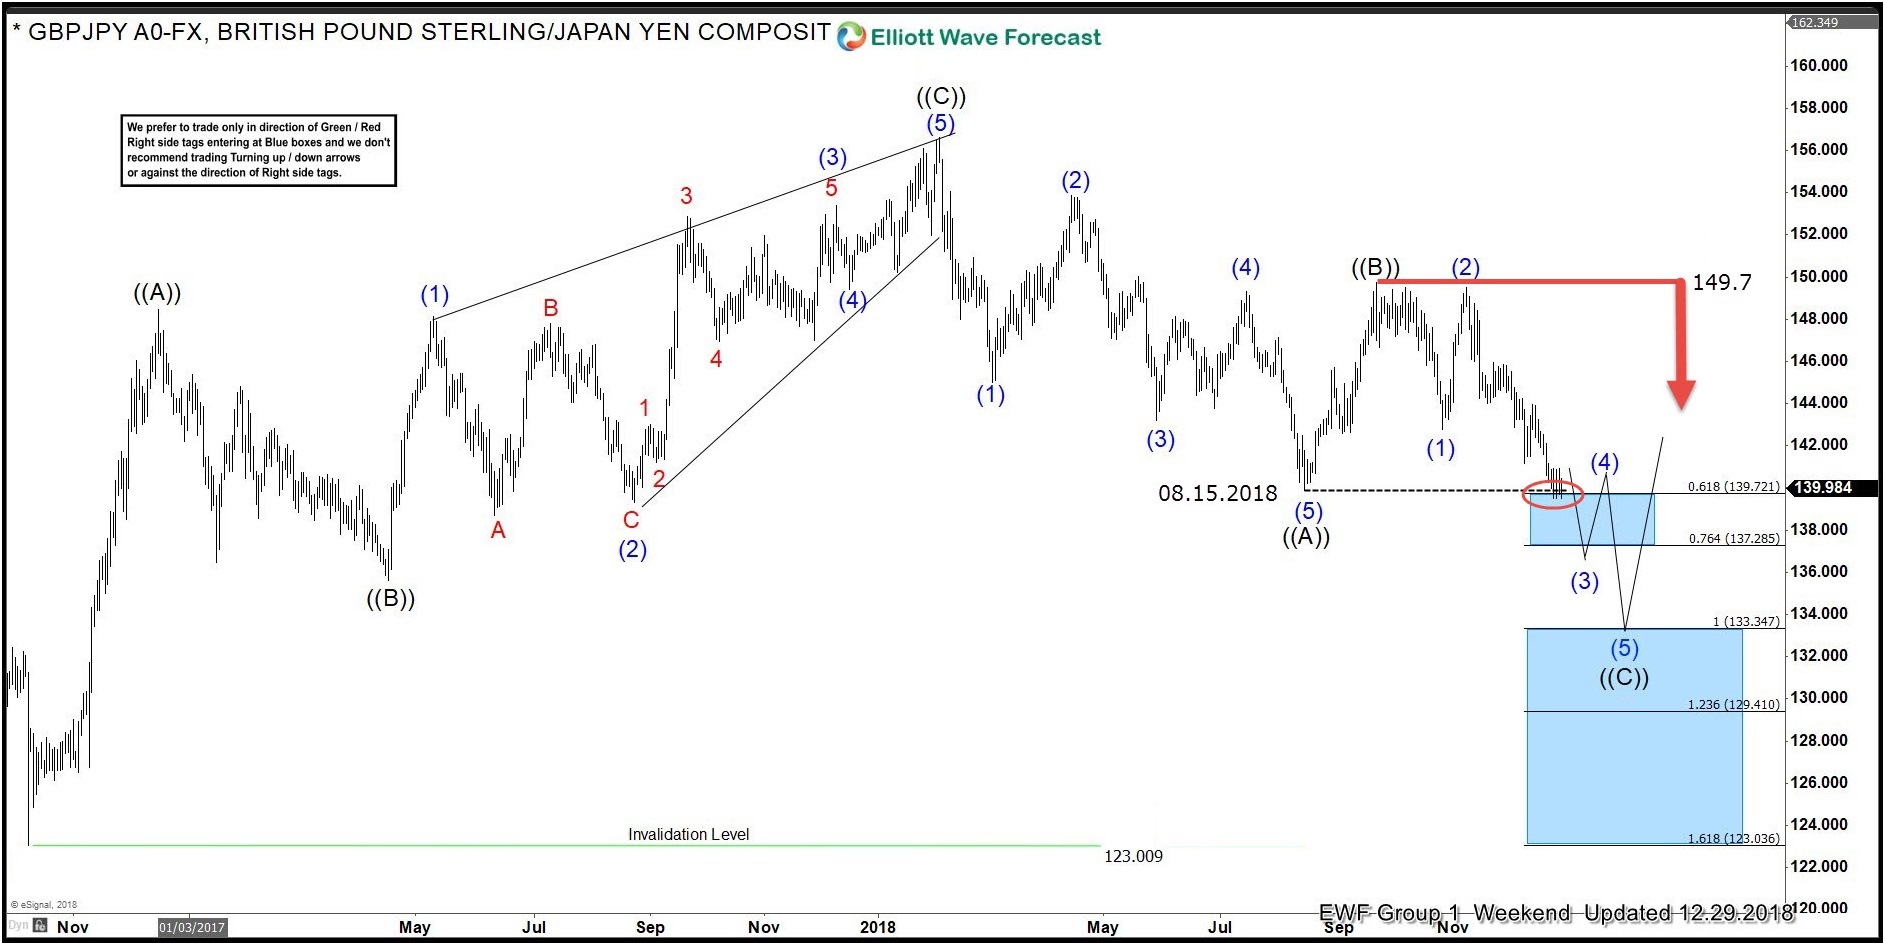
GBPJPY Daily Elliott Wave Analysis 12.29.2018
Break of August 15th low made the cycle from the January peak incomplete to the downside. The pair is now bearish against the 149.7 peak and we’re calling for further decline. As we can see on the chart below , the pair is seating at the 0.618 Fibonacci extension , making sideways consolidation. The pair has scope to reach 133.34-129.41 area before buyers apear again for 3 wave bounce at least. We don’t recommend buying it against the main bearish trend and favour the short side as far as 149.7 pivot holds.
Now, let’s see what short term structure looked like back then.
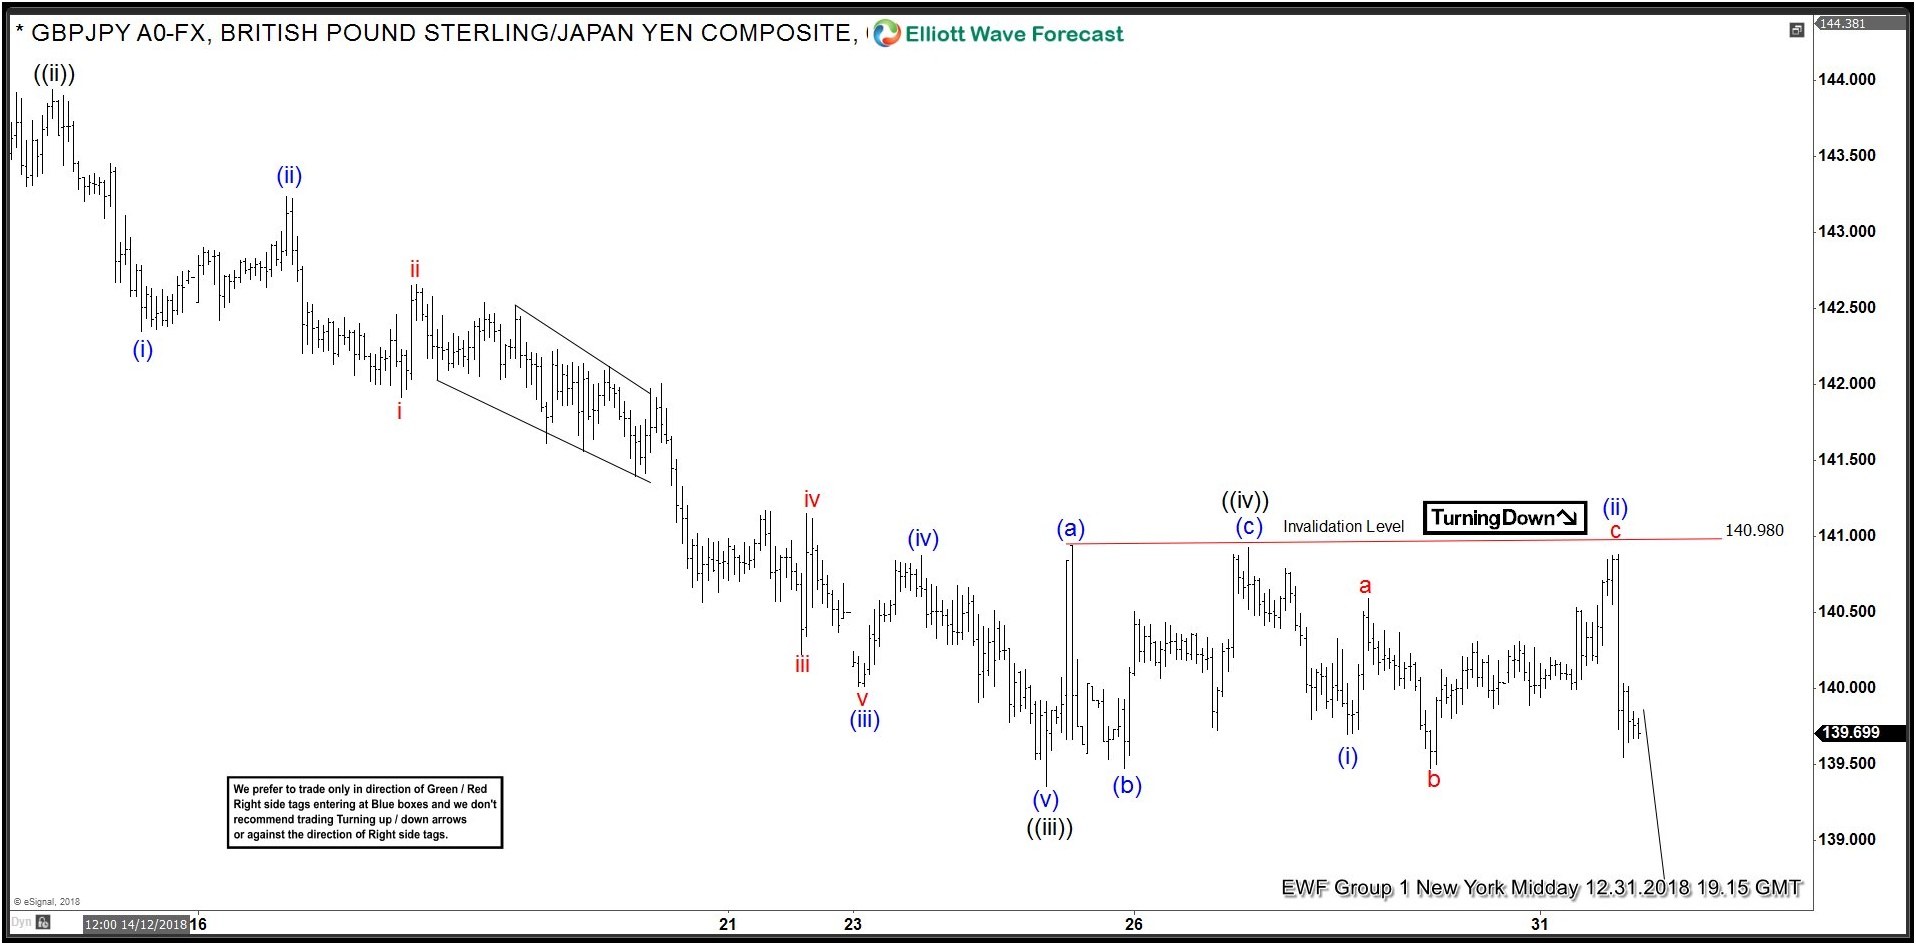
GBPJPY 1 Hour Elliott Wave Analysis 12.31.2018
Decline looks impulsive and we are calling short term recovery completed at 140.98 high as wave ((iv)). Now, as far as the price stays below mentioned level we expect the pair to trade lower, however need to see new short term low ( break below wave ((iii)) low) in order to confirm wave ((v)) is in progress. We don’t recommend buying the pair, and favor the short side. We like selling the rallies in 3,7,11 swings when get chance.
Eventually we got the proposed decline and target has been reached at 133.34- 129.41 . Buyers have appeared at the extreme zone as expected and we are getting rally. Cycle from the January peak is counted completed. You can check most recent charts in the membership area of the site.
Note: Some labelings have been removed from the chart in order to protectKeep in mind market is dynamic and presented view could have changed in the mean time. Best instruments to trade are those having incomplete bullish or bearish swings sequences. We put them in Sequence Report and best among them are shown in the Live Trading Room.
Become a Successful Trader and Master Elliott Wave like a Pro. Start your Free 14 Day Trial at - Elliott Wave Forecast.
Author

Elliott Wave Forecast Team
ElliottWave-Forecast.com


