|

GBP/CHF Slides After Hitting Resistance Near 1.2300

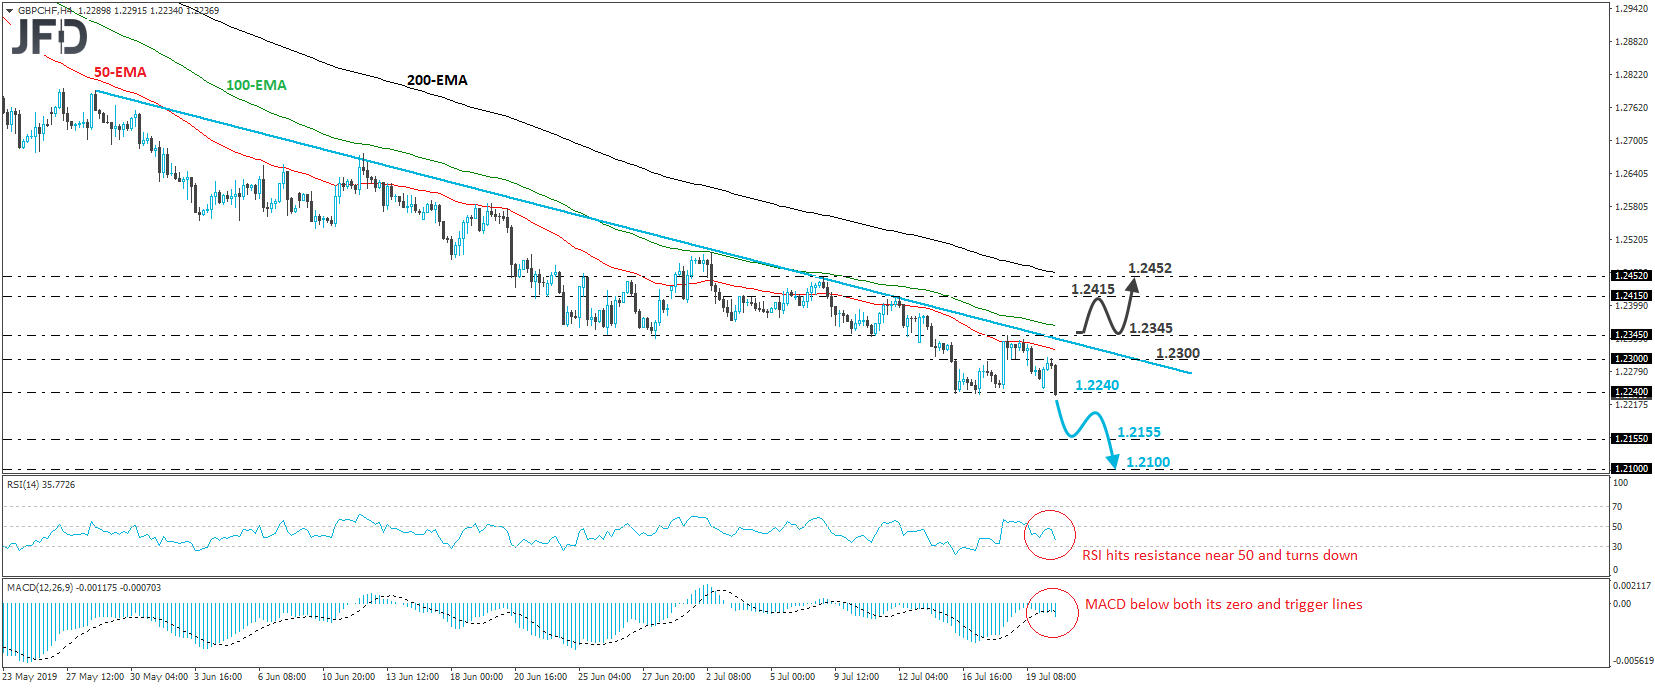
GBP/CHF slid during the European morning Monday, after it hit resistance fractionally above the 1.2300 barrier. Overall, the rate is trading below all three of our moving averages, as well as below the downside resistance line drawn from the peak of May 28th, and thus we would consider the near-term outlook to be negative for now.

At the time of writing, the rate is trading fractionally below the 1.2240 key support obstacle, which is marked by the lows of July 16th and 17th. That hurdle also prevented the rate from falling further back in March, June and August 2017. If the bears are willing to stay in the driver’s seat, then we could see them setting the stage for declines towards the 1.2155 barrier, defined by the low of January 17th, 2017, where another break may extend the slide towards the 1.2100 area, which is marginally below the low of the day before.

Taking a look at our short-term momentum studies, we see that the RSI turned down after it hit resistance near its 50 line, and that the MACD lies below both its zero and trigger lines, pointing down as well. These indicators detect negative speed and suggest that there is ample room for the pair to continue drifting south for a while more.

In order to abandon the bearish case and start examining whether the bulls have gained the upper hand, we would like to see a decisive recovery above 1.2345. Such a move would bring the rate above the aforementioned downside line and would also confirm a forthcoming higher high on the daily chart. GBP/CHF could then climb towards the high of July 12th, at around 1.2415, the break of which may allow extensions towards the peak of July 9th, at 1.2452.
GBPCHF

JFDBANK.com - One-stop Multi-asset Experience for Trading and Investment Services


Author

More from JFD Team
Share:

Editor's Picks

GBP/USD retreats from weekly high vs firmer USD as focus shifts to BoE, US data

The GBP/USD pair struggles to capitalize on the previous day's strong move up to the weekly high and drifts lower during the Asian session on Thursday. Spot prices currently trade around mid-1.3300s, down over 0.10% for the day, and, for now, seem to have stalled the recovery move from a nearly four-week low, touched on Tuesday.

EUR/USD edges lower to near 1.1450 ahead of German/ EU GDP

EUR/USD trades with mild losses around 1.1450 in the early European hours on Thursday. The US Dollar recovers ground on renewed Mideast hostilities, despite a cautious Fed hold. Traders now brace for preliminary readings of the second-quarter Gross Domestic Product (GDP) from Germany, the Eurozone and the US. 


Gold extends intraday rejection slide from $4,100

Gold extends its intraday rejection slide from the $4,100 mark and moves further away from a one-week high, touched the previous day. The US Dollar regains positive traction following Wednesday's post-FOMC decline and is seen as a key factor weighing on the commodity. 

Mixed signals leave XRP and XLM at crossroads

Ripple and Stellar are trading at critical technical levels on Thursday. XRP has stabilized above the psychological $1.00 support, while XLM is testing support at $0.173. Traders should be cautious as mixed derivatives metrics keep the outlook uncertain for both altcoins. Derivatives data shows mixed sentiment among traders. CoinGlass’ long-to-short ratio for XRP reads 1.02 on Thursday.

Fed review: Reversing course (?)
At face value, the FOMC's 9-3 split decision hold was exactly in line with the expectations we laid out in our Fed preview - a divided hold, 22 July. We also named the three dissenters - Hammack, Logan and Kashkari - as the most likely hawks to support rapid tightening.
US Dollar mid-year outlook: Exceptional currency, exceptional risks?
The US Dollar enters the second half of 2026 in a markedly different position from a year ago. The King currency has recovered, reflecting persistent US inflation, changing expectations for Fed policy, geopolitical tensions and renewed demand for defensive assets.
















