GBP/CAD finds support in blue box, buyers achieve first target

In the long term, GBPCAD is developing as a bearish market within a proposed diagonal structure. The Supercycle degree wave (I) was completed in May 2010, followed by a bounce for wave (II), which ended in November 2015. From that point, wave (III) moved lower and completed in October 2022. Notably, waves (I), (II), and (III) are all 3/7 swing structures, supporting our proposed long-term diagonal structure for members. Diagonals are often composed of five sub-waves, with each wave subdivided into three waves.
Currently, the rally from October 2022, where wave (III) ended, is unfolding as another three-swing sequence. Therefore, we can classify this rally as wave (IV). However, it appears that wave (IV) is an incomplete corrective sequence. Based on projections, wave (IV) could extend to at least 1.96 – 2.08.
We prefer trading along the path of an incomplete sequence. With this in mind, we advised members to buy pullbacks in 3, 7, or 11 swings, while keeping invalidation levels intact at each stage. Let’s now discuss the latest setup we shared with members.
GBP/CAD Elliott Wave trade setup – 27th March 2025
At the January 2025 low, wave ((2)) of (1) of c of (IV) was completed. From this low, an impulsive sequence began, forming wave (1) of ((3)). Within wave (1) of ((3)), a pullback for wave 4 of (1) started in March 2025 after the pair reached its highest price since July 2016.
We planned to buy from the extreme of wave 4 of (1), provided it completed a 3-swing or 7-swing pullback—also known as zigzag and double zigzag structures, respectively. As the pullback for wave 4 of (1) approached its extreme, we shared the H4 chart below with members.
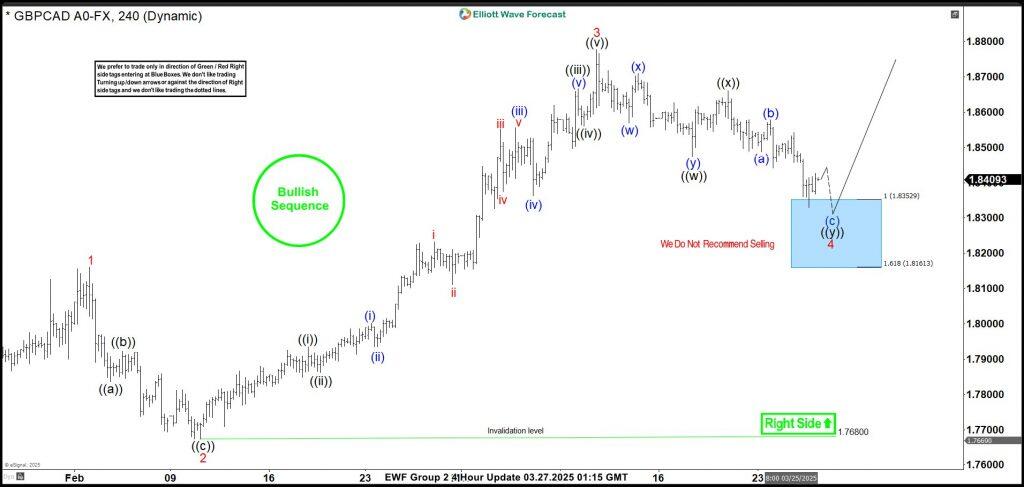
GBP/CAD, H4
The chart above highlights the Blue Box where we expected members to enter long positions. We anticipated that wave 4 would complete in this zone, providing support for wave 5 of (1).
If the price rallied as expected, we advised members to take partial profit at 1.8530 and move the remaining position to breakeven. This strategy allowed for preparation in case wave 4 developed into a double correction. However, if an impulsive move emerged for wave 5, we planned to take the second profit at 1.9050.
GBP/CAD Elliott Wave trade setup – 27th March 2025
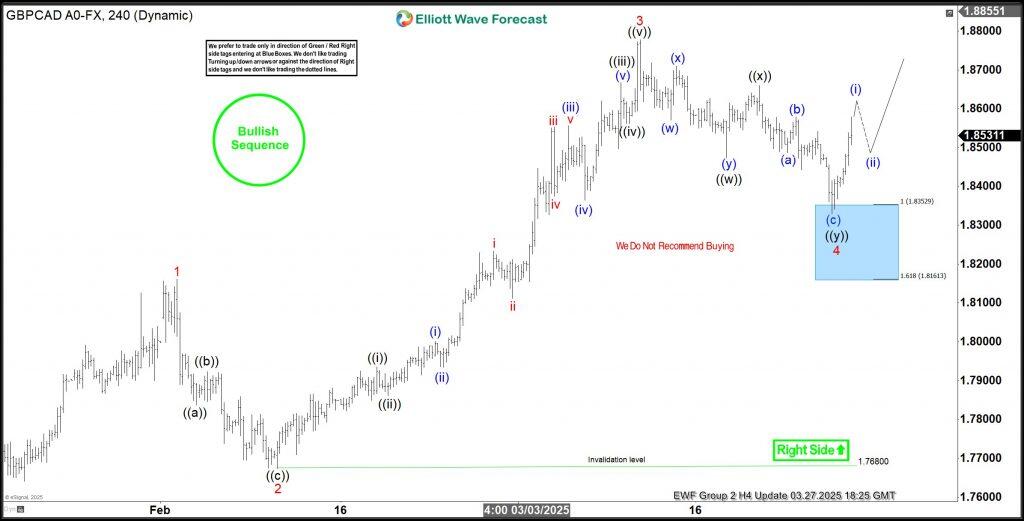
GBP/CAD H4
Later, on March 27, 2025, GBPCAD rallied from the Blue Box, as anticipated. The price surpassed the first target at 1.8530, allowing traders to take partial profit and adjust the stop on the remaining position to breakeven.
Author

Elliott Wave Forecast Team
ElliottWave-Forecast.com


