GBP/AUD - Be thorough, know the big picture!

The International Monetary Fund has just announced a downgrade in its growth forecasts for the U.K. economy, revising 2017 expansion from 2.0% per cent to 1.7% per cent. This is the first time it has adjusted the figures post-Brexit.
Sterling/British Pound has recently traded higher against the US$ dollar prior to the GDP release but this is more to do with US$ dollar weakness than sterling strength. The Pound is still struggling to gain upside momentum across several other currency crosses, including the Aussie Dollar – we thought to take a more in-depth look at the GBP/AUD.
Establishing Direction
The results of this Elliott Wave analysis reveals the current direction of the GBP/AUD but also something more interesting than this too. Yes, the direction is downwards at the moment. Shorter-term patterns show the October ’16 – May ’17 upswing ended a counter-trend zig zag pattern between 1.5791 and 1.7652 which explains why it has rapidly declined afterwards. The zig zag ended a 4th wave corrective upswing, the following decline has begun a 5th wave decline. But the real catch is inserting the larger five wave impulse decline that began from the earlier Sep.’15 peak of 2.2177 into the big picture. Knowing how this fits into the larger, longer-term pattern development will help you to avoid falling into certain traps later.
Know the Big Picture
The Elliott Wave Principle tells us that the direction of trend is determined by a five wave sequence – if you identify a five wave impulse pattern trading higher, that defines the direction of trend, vice-versa if the impulse pattern is declining. But there are exceptions – if the five wave impulse is in a terminal location, i.e. is itself a final 5th within the larger/aggregate pattern, or perhaps as wave C within a zig zag. In these cases, the direction of the impulse is about to go into reverse. There is another exception too, one which R.N. Elliott discovered that is actually, mostly underestimated because of its recurrence frequency – it’s the expanding flat pattern. This subdivides 3-3-5, so its third and final sequence unfolds into a five wave pattern, then following completion, trend changes into the opposite direction. The GBP/AUD weekly data-series provides us with an example of an expanding flat, but with an unusual twist.
Expanding Flat
Before taking a look at the expanding flat, let’s see how it fits into the long-term picture. The wave count of the GBP/AUD confirms its decline from the year-1865 period ended a five wave impulse pattern into the October 1976 low of 1.2840. A multi-decennial zig zag upswing has since begun where cycle wave A ended the initial advance into the Sep.’01 high at 3.0392. The quality of this advance which unfolded into a five wave diagonal remains the cornerstone or the foundation for the continuation of this long-term upswing. Wave B of the zig zag then ended its decline in March ’13 at 1.4381. This was a really deep correction, more than a typical fib. 76.4% retracement so there is a relative probability that wave B ended there with cycle wave C advances now underway.
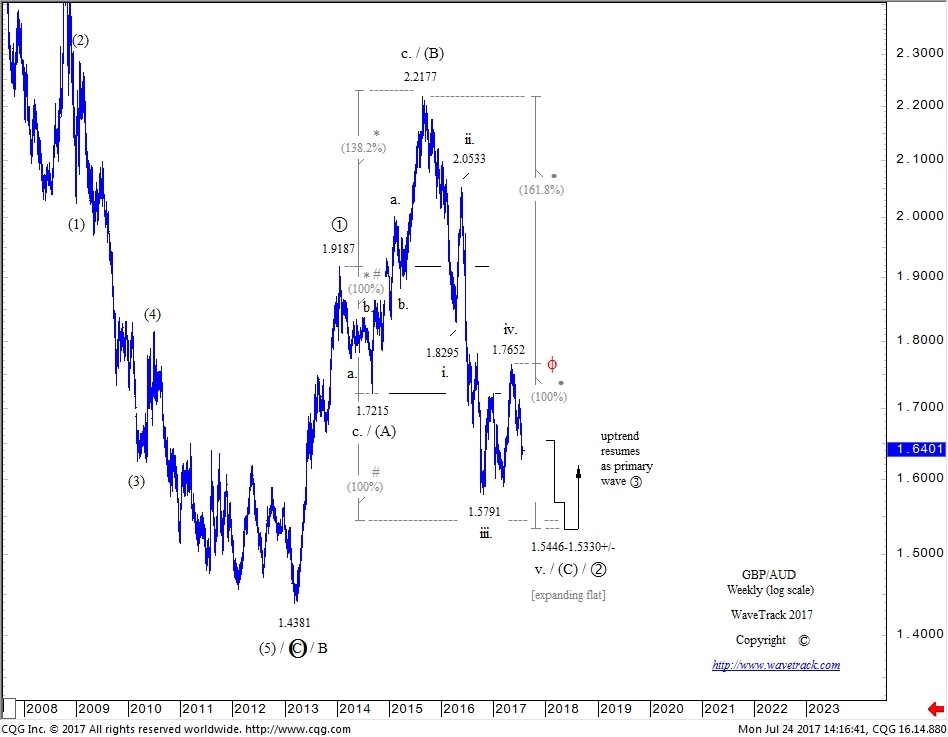
Cycle wave C has begun lifting higher as primary wave 1 ending into the Jan.’14 high of 1.9187 – see fig #1. But after that, an unusual expanding flat has unfolded as primary wave 2 which is still working lower to this day. Unless you know the longer-term picture, it would be easy to misinterpret this advance from 1.4381 to the Aug.’15 high of 2.2177 as ending a counter-trend zig zag with trend now downwards – but it can’t be if the preceding uptrend was already established in cycle wave A’s five wave diagonal advance mentioned earlier – neither can cycle wave B extended lower because it was already very deep when it completed at 1.4381. And so, through a logical process of deduction, we arrive at this latest count where primary wave 1 of cycle wave C ended an initial advance to 1.9187 with wave 2 following but unfolding into an expanding flat.
Fibonacci-Price-Ratios
There are common Fibonacci-Price-Ratios that govern expanding flat patterns and these help identify their completion. For example, once the initial swing has unfolded as wave (A) of the pattern, extending this by a fib. 14.58%, 23.6% or 38.2% (subliminal) ratio, above and below, sets targets for completing waves (B) and (C). These tend to form the measured reversal levels about 80% per cent of the time. About 15% per cent end outside of this range at the fib. 61.8% ratio level and the remaining 5% per cent extend to what we describe as expansive ratios, i.e. 100%, 1.236%, 138.2%, in other words, the inverse of subliminal ratios. These are rare, but occasionally, we manage to identify one – and yes, this applies to primary wave 2 of the GBP/AUD count.
The origin of primary wave 2’s expanding flat begins from 1.9187 with intermediate wave (A) declining into a short retracement to 1.7215 – see fig #1 again. Wave (B) then staged a huge advance to 2.2177, extending wave (A) by a fib. 138.2% ratio whilst subdividing into a required three wave zig zag pattern. Then finally, wave (C) declines unfold into a five wave impulse pattern labelled in minor degree, i-ii-iii-iv-v. Note that minor wave iv. ended recently at 1.7652 as a zig zag with minor wave v. five in decline now. We haven’t entirely written-off the idea that minor wave iv. four is set to bounce higher now but range trade into a more complex pattern, i.e. triangle, but what this wave count does prove is that the impulse decline as intermediate wave (C) remains incomplete with downside targets to min. 1.5446. This is derived from extending wave (A) by a fib. 100% ratio and the lowest of the two targets at 1.5330+/- is derived by extending minor waves i-iv one-four by a fib. 61.8% ratio.
Summing up, it seems that interpreting an expanding flat as primary wave 2 seems far-fetched because of the normal parameters that define the dimensions of the pattern. But when placed into the context of the longer-term pattern, we begin to see the true path of its ongoing development.
Subscribe and get the latest forecasts on Stocks, FX & Commodities – NOW!
Author

Peter Goodburn
WaveTrack International GmbH
WTI HISTORY


