|

FTSE 100 Could Run in a New Bearish Leg

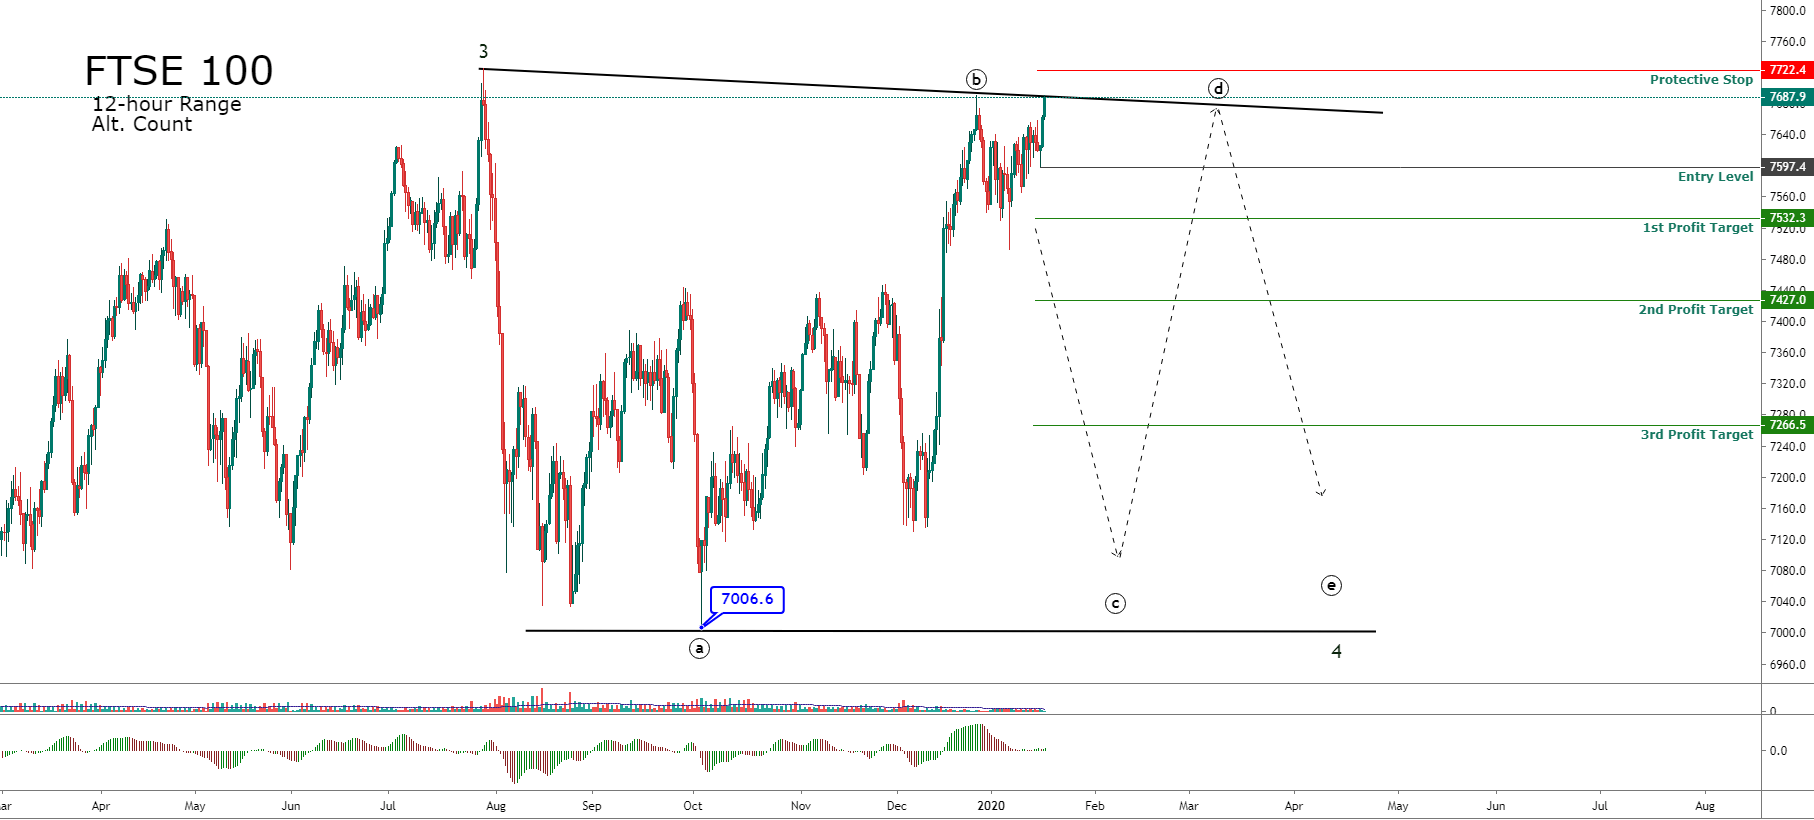
FTSE 100, in its 12-hour chart, moves in the upper line of a potential triangle structure in progress. The current bullish segment of the sideways formation tests the previous high reached on past December 27th.

FTSE

The scenario corresponds to an alternative Elliott Wave count of FTSE 100, which considers the current sequence of a potential triangle structure in progress.

According to this count, the British index could be running in a wave 4 of Minor degree labeled in green. At the same time, the price could be advancing in a wave b of Minute degree marked in black. If this scenario is correct, the completion of the bullish leg that began on October 03rd at 7,006.6 pts could end soon.

A short position will be trigger if the price drops and closes below 7,597.4 points, which could drive to the British index to find as a first profit target at 7,532.3 points.

The potential bearish movement could extend its retraces to 7,427 pts until 7,266.5 pts.

The invalidation level of our bearish scenario locates at 7,722.4 pts.

Trading Plan Summary

Entry Level: 7,597.4 pts.

Protective Stop: 7,722.4 pts.

1st Profit Target: 7,532.3 pts.

2nd Profit Target: 7,427.0 pts.

3rd Profit Target: 7,266.5 pts.


Try Secure Leveraged Trading with EagleFX!

Author

EagleFX Team

EagleFX Team is an international group of market analysts with skills in fundamental and technical analysis, applying several methods to assess the state and likelihood of price movements on Forex, Commodities, Indices, Metals and

More from EagleFX Team
Share:

Editor's Picks

EUR/USD trims gains, hovers around 1.1900 post-US data

EUR/USD trades slightly on the back foot around the 1.1900 region in a context dominated by the resurgence of some buying interest around the US Dollar on turnaround Tuesday. Looking at the US docket, Retail Sales disappointed expectations in December, while the ADP 4-Week Average came in at 6.5K.

GBP/USD comes under pressure near 1.3680

The better tone in the Greenback hurts the risk-linked complex on Tuesday, prompting GBP/USD to set aside two consecutive days of gains and trade slightly on the defensive below the 1.3700 mark. Investors, in the meantime, keep their attention on key UK data due later in the week.

Gold loses some traction, still above $5,000

Gold faces some selling pressure on Tuesday, surrendering part of its recent two-day advance although managing to keep the trade above the $5,000 mark per troy ounce. The daily pullback in the precious metal comes in response to the modest rebound in the US Dollar, while declining US Treasury yields across the curve seem to limit the downside.

XRP holds $1.40 amid ETF inflows and stable derivatives market

Ripple trades under pressure, with immediate support at $1.40 holding at the time of writing on Tuesday. A recovery attempt from last week’s sell-off to $1.12 stalled at $1.54 on Friday, leading to limited price action between the current support and the resistance.

Dollar drops and stocks rally: The week of reckoning for US economic data

Following a sizeable move lower in US technology Stocks last week, we have witnessed a meaningful recovery unfold. The USD Index is in a concerning position; the monthly price continues to hold the south channel support.

XRP holds $1.40 amid ETF inflows and stable derivatives market

Ripple trades under pressure, with immediate support at $1.40 holding at the time of writing on Tuesday. A recovery attempt from last week’s sell-off to $1.12 stalled at $1.54 on Friday, leading to limited price action between the current support and the resistance.