Four Signs of A Bear Market
/definition-of-etf-21007500_XtraLarge.jpg)
Chaos Clinic for 8/16/2019
I am a believer that the Universe gives you signs. Some say your spirit guides send them. I don't know for sure that I have spirit guides, but if I do, one of them is surely Chief Little Raven. He was an Arapahoe chief who worked for peace between his people and the settlers in Denver. There is a monument to him at a trail head near Brainard Lake, where we go camping. On the first weekend of August, we went camping. This included a hike up to "see the Chief." I always talk to him, since I admire him. Sometimes I imagine that he talks back.
The next morning, I was walking the dogs in the camp ground, and I saw something I've never seen in the wild - a bear. Fortunately he did not see us. He was leaving the campground, heading south. I couldn't help but think that this was an omen of a Bear Market, courtesy of Little Raven.
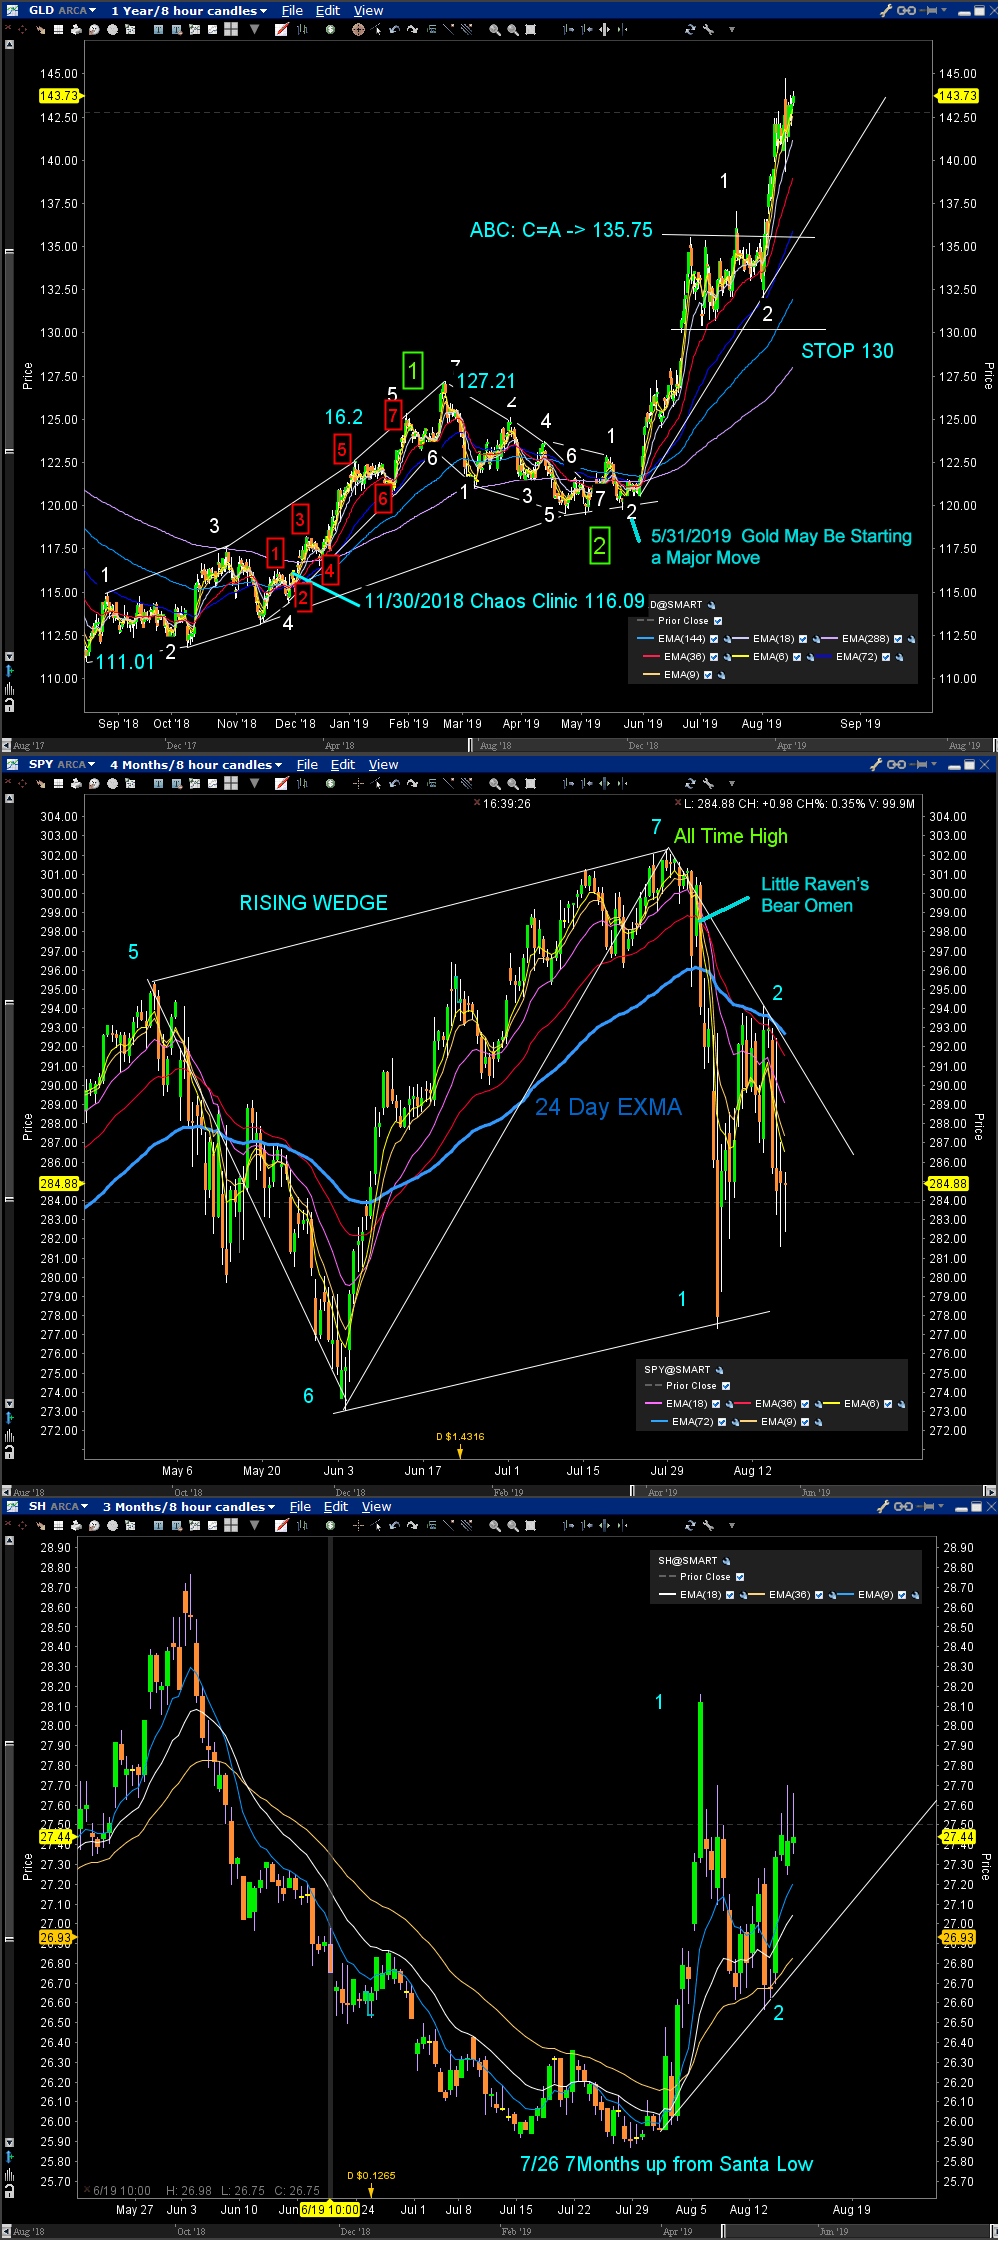
OK, that may sound a bit crazy, but these three charts are three more signs of a bear market. The top chart is the GLD exchange traded fund. It began moving up in the fourth quarter of 2018, about the time the S&P made its 2018 high. It looked like money was starting to flow out of stocks and into gold. I pointed this out in my 11/30/2018 Chaos Clinic. I've mentioned gold several time since. In my 5/31/2019 Chaos Clinic I said it looked like it was starting a major move, What a move it has been. And it has much more to go.
The second chart is an 8 hour bar chart for SPY, over the last 4 months. The rally to the All Time High formed a very clear rising wedge. I pointed out a topping pattern in the S&P futures in my 7/19/2019 and 8/2/2019 Chaos Clinics. Since then, the S&P has been wild, dropping sharply twice, and is now in what looks like move 3 of 7 of a down Chaos Clamshell. The 800 point Dow decline this week, blamed on the inverted yield curve, really spooked investors.
Significantly, this drop has turned the 24 day EXMA down. The last swing of it was about 60 days, so a down move of 60 to 90 days is probable. And this could be just move 1 of a larger Chaos Clamshell.
When the market turns down, many long term traders hedge their portfolios by using S&P short Exchange Traded Funds, such as the Proshares SH. So I watch it for signs of this sort of hedging. The third chart is an 8 hour bar chart for SH, It shows that recent trading has turned SH up, forming a move 1 and 2 of 7 in an up Chaos Clamshell. The low at 2 held above the 12 day EXMA. so further advance is probable.
Together, all this tells me US stocks are in a bear market.
Author

Dr. Al Larson, PhD
MoneyTide.com
Dr. Al Larson holds a Ph.D. in Electrical and Computer Engineering from the University of Wisconsin. He is a 1964 Distinguished Graduate of the U. S. Air Force Academy.


