Forex Insights: Trade Balance today, Non Farm Payrolls on the horizon

USD: Dec '23 is Down at 103.990.
Energies: Jan '24 Crude is Down at 71.49.
Financials: The Mar '24 30 Year T-Bond is Down 10 ticks and trading at 119.03.
Indices: The Dec '23 S&P 500 emini ES contract is 30 ticks Higher and trading at 4582.50.
Gold: The Dec'23 Gold contract is trading Up at 2038.30.
Initial conclusion
This is not a correlated market. The USD is Down and Crude is Down which is not normal, and the 30 Year T-Bond is trading Lower. The Financials should always correlate with the US dollar such that if the dollar is Higher, then the bonds should follow and vice-versa. The S&P is Higher and Crude is trading Lower which is correlated. Gold is trading Higher which is correlated with the US dollar trading Down. I tend to believe that Gold has an inverse relationship with the US Dollar as when the US Dollar is down, Gold tends to rise in value and vice-versa. Think of it as a seesaw, when one is up the other should be down. I point this out to you to make you aware that when we don't have a correlated market, it means something is wrong. As traders you need to be aware of this and proceed with your eyes wide open. Asia is trading Higher with the exception of the Shanghai exchange. Currently all of Europe is trading Higher.
Possible challenges to traders
-
ADP Non-Farm Employment Change is out at 8:15 AM EST. This is Major.
-
Revised Nonfarm Productivity q/q is out at 8:30 AM EST. This is not Major.
-
Revised Unit Labor Costs q/q is out at 8:30 AM EST. This is not Major.
-
Trade Balance is out at 8:30 AM EST. This is Major.
-
Crude Oil Inventories are out at 10:30 AM EST. This is Major.
Treasuries
Traders, please note that we've changed the Bond instrument from the 30 year (ZB) to the 10 year (ZN). They work exactly the same.
We've elected to switch gears a bit and show correlation between the 10-year bond (ZN) and the S&P futures contract. The S&P contract is the Standard and Poor's, and the purpose is to show reverse correlation between the two instruments. Remember it's likened to a seesaw, when up goes up the other should go down and vice versa. Today we aren't dealing with a correlated market and our bias is to the Upside.
Yesterday the ZN migrated Higher at around 9:45 AM EST as the S&P hit a High at around the same time. If you look at the charts below the S&P gave a signal at around 9:45 AM and the ZN started its Upward trend. Look at the charts below and you'll see a pattern for both assets. S&P hit a High at around 9:45 AM and migrated Lower. These charts represent the newest version of MultiCharts and I've changed the timeframe to a 15-minute chart to display better. This represented a Long opportunity on the 10-year note, as a trader you could have netted about 20 plus ticks per contract on this trade. Each tick is worth $15.625. Please note: the front month for the ZN is now Dec '23. The S&P contract is now Dec' 23. I've changed the format to filled Candlesticks (not hollow) such that it may be more apparent and visible.
Charts courtesy of MultiCharts built on an AMP platform
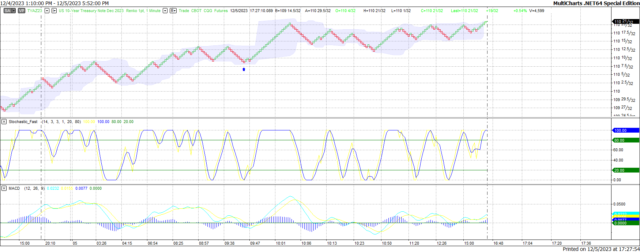
ZN - Dec 2023 - 12/05/23
-638374617431551892.png)
S&P - Dec 2023 - 12/05/23
Bias
Yesterday we gave the markets a Downside bias as the Bonds and the USD were Higher Tuesday morning and this usually represents a Down Day. The markets didn't disappoint as the Dow dropped 80 points; the S&P dropped 3 but the Nasdaq gained 45. All in all, a mainly lower day across the markets. Today we aren't dealing with a correlated market, but our bias is to the Upside.
Could this change? Of Course. Remember anything can happen in a volatile market.
Commentary
Now had I followed the scenario of One Day Down, Next Day Up I would have automatically given the markets an Upside bias yesterday. But I follow the mindset of assume and those of you who have ever served in Corporate America knows exactly what that is. Bottom line don't ever assume anything when it comes to these markets. Today we are light on economic news with only Trade Balance as the real major news item. That will change later this week as we do have Non-Farm Payrolls out on Friday.
Author

Nick Mastrandrea
Market Tea Leaves


