Focus on US Q1 growth with the dollar still strong

Market Overview
Politics is still a factor to watch in markets as the two leaders of North and South Korea come together for an historic meeting that will hopefully smooth the path towards continued de-escalation of tensions on the Korean peninsula. However it was interesting to see yesterday that Oleg Deripaska of Russian aluminium producing giant Rusal has chosen to defy the US and continue to retain a controlling stake in the company. Will this now begin to increase tensions one more? It could fire up the prospects of sanctions from the US over Russia, and certainly sent the aluminium price shooting higher once more. The impact was also seen across markets, with the safe haven German Bund yield sharply falling and subsequently all the moves to stabilise the euro during the ECB press conference was undone as the euro sold off. Although the US 10 year yield has dropped back under 3.0% again, interest rate differentials are still playing a role in market moves. This is likely to continue today with the announcement of US Q1 growth numbers. Fears over inflation have helped to drive yields strongly higher in the past week and if this is accompanied by decent growth numbers too then the market could see this path continue. Expect to see elevated volatility on Sterling/Dollar today as the UK also releases its own Q1 GDP. Neither the UK, nor the US are expected to shoot the lights out on growth but surprises will certainly move the markets. Overnight, as widely expected, the Bank of Japan held rates at -0.1% and the yield curve control with the 10 year JGB target of zero. However in a surprise move it removed the timing of its inflation target, which is seen as a slight dovish move as it suggests there is less pressure for the BoJ to get inflation higher.

Wall Street managed to reclaim some lost ground yesterday with the S&P 500 +1.0% at 2667, whilst Asian markets have also responded positively with the Nikkei +0.7%. European markets were mixed yesterday but look to be more settled in slightly positive early moves, this despite Wall Street futures ticking slightly lower initially. In forex, there is a sense that the dollar retains its recent strength and is slightly outperforming. Sterling is settled ahead of UK GDP whilst the commodity currencies are showing slight underperformance. In commodities, there is an early consolidation on gold having broken below $1321 support yesterday, whilst oil continues to trade in its one week range.
Today is all about economic growth as both the UK and US both release a first look at their GDP numbers for the first quarter. UK Q1 GDP (prelim) is at 0930BST and is expected to show a rather drab +0.3% which would be down from the final reading of (a downwardly revised) +0.4% (in Q4 2017. The Advance reading of US Q1 GDP is at 1330BST is expected to come in at an annualised +2.0% which would be below the Q4 reading of +2.9%. The US estimate has been steadily beaten down in recent days and the Atlanta Fed GDPNow model suggested +2.0% so this should be fairly close. There are also a couple of central bankers speaking today with the SNB’s Thomas Jordan at 0900BST and the BoE’s Mark Carney at 1500BST.
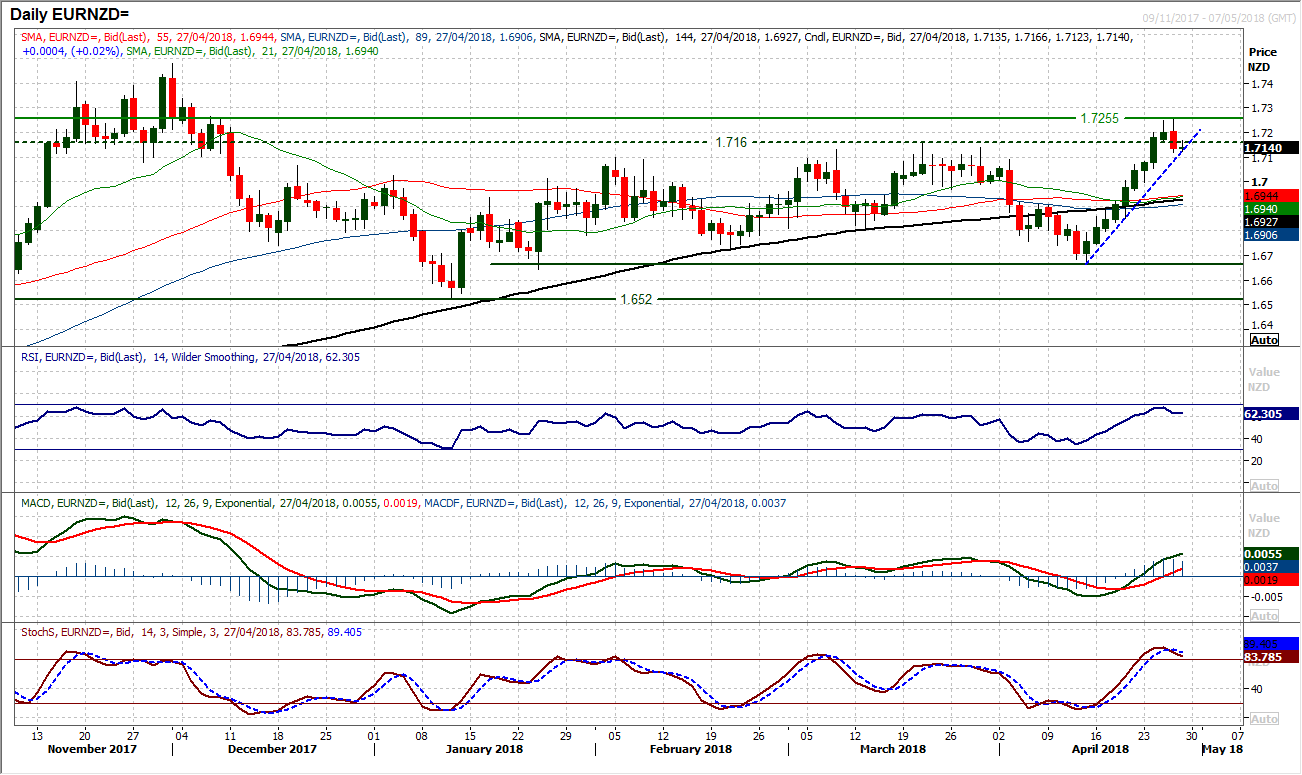
Chart of the Day – EUR/NZD
Has the euro just made a false breakout against the Kiwi? The New Zealand dollar has been incredibly weak for the past couple of weeks with an almost straight line run of nine consecutive positive closes on EUR/NZD culminating in a breakout above 1.7160. However yesterday as the euro saw a remarkable one day decline, a bearish key one day reversal (bearish engulfing candle) was posted, leaving a high at 1.7255 and a strong reversal signal. The move has seen the RSI once more top out just under 70, with the Stochastics crossing lower (although yet to confirm a sell signal). Closing back below 1.7160 is an important topping move that is reflected on the hourly chart which has now shifted configuration to negative. The way the market responds to this move today will be key as if the selling pressure confirms the flip back lower then there could be a key corrective move underway once more. The hourly chart shows 1.7160/1.7185 is now a basis of resistance, whilst the 55 hour moving average which had been an excellent basis of support during the rally has turned over and will be watched as a basis of resistance (currently 1.7195). The daily chart shows 1.7100 is an old basis of resistance which is now support to be tested on renewed weakness, whilst the next support beyond there is at 1.6970.
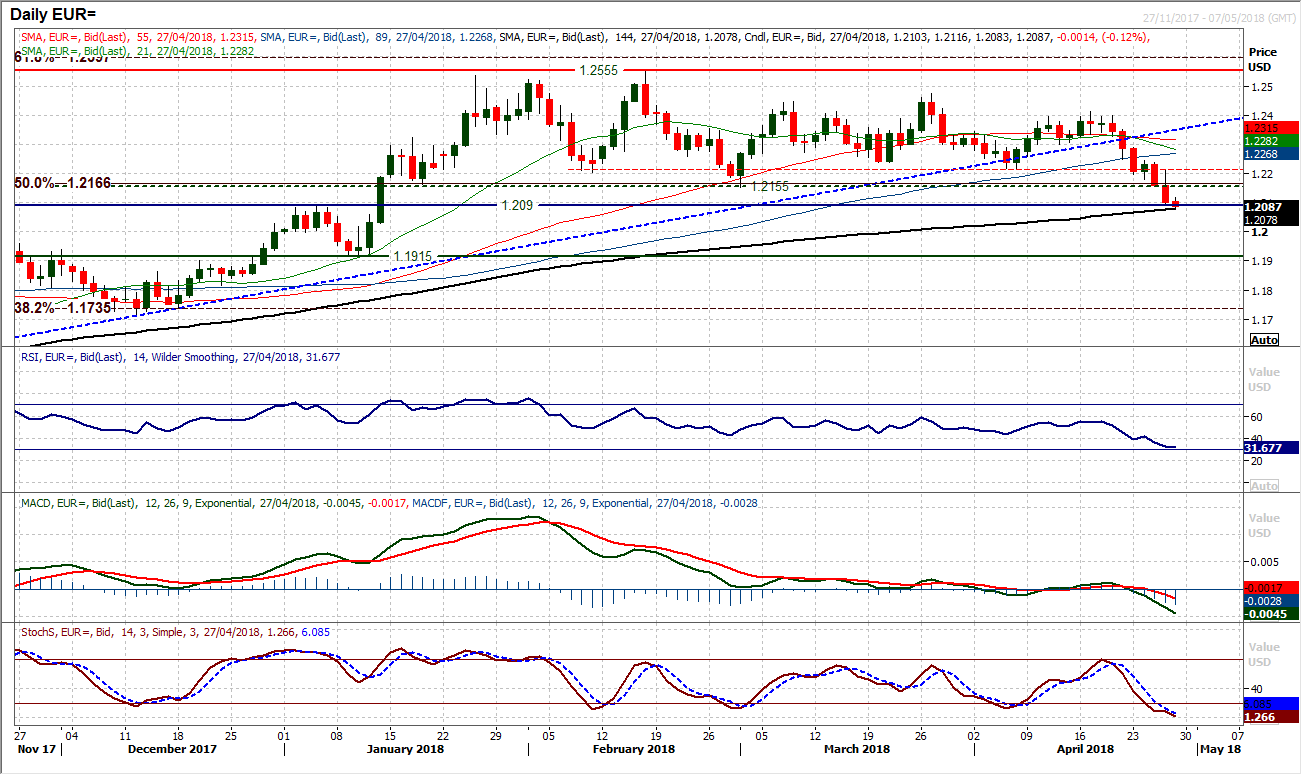
EUR/USD
The volatility and key moves that are usually seen on ECB day are generally around changes in monetary policy developments from the ECB. However this was not the case yesterday as Mario Draghi helped to calm the selling pressure on the euro, only for the dollar to make gains later in the session. A decisive bear candle subsequently formed which has now confirmed a breakdown of the 400 pip sideways range that the pair has been stuck in for the past few months. The close below $1.2155 with such a big negative candle, along with momentum indicators decisively bearish is now a significant signal. There is now an area of big overhead supply between $1.2155 and at least up towards $1.2240 which is now going to hamper any attempts for a euro recovery near term. Rallies are now a chance to sell and key downside support is under threat. Immediately the old 2017 breakout highs of $1.2090 is being tested now and beyond that the next level is $1.1915. For over a week now the market has formed lower highs on a daily basis. The hourly chart shows negative configuration across momentum and any unwinding move towards 50/60 on the hourly RSI is a chance to sell.
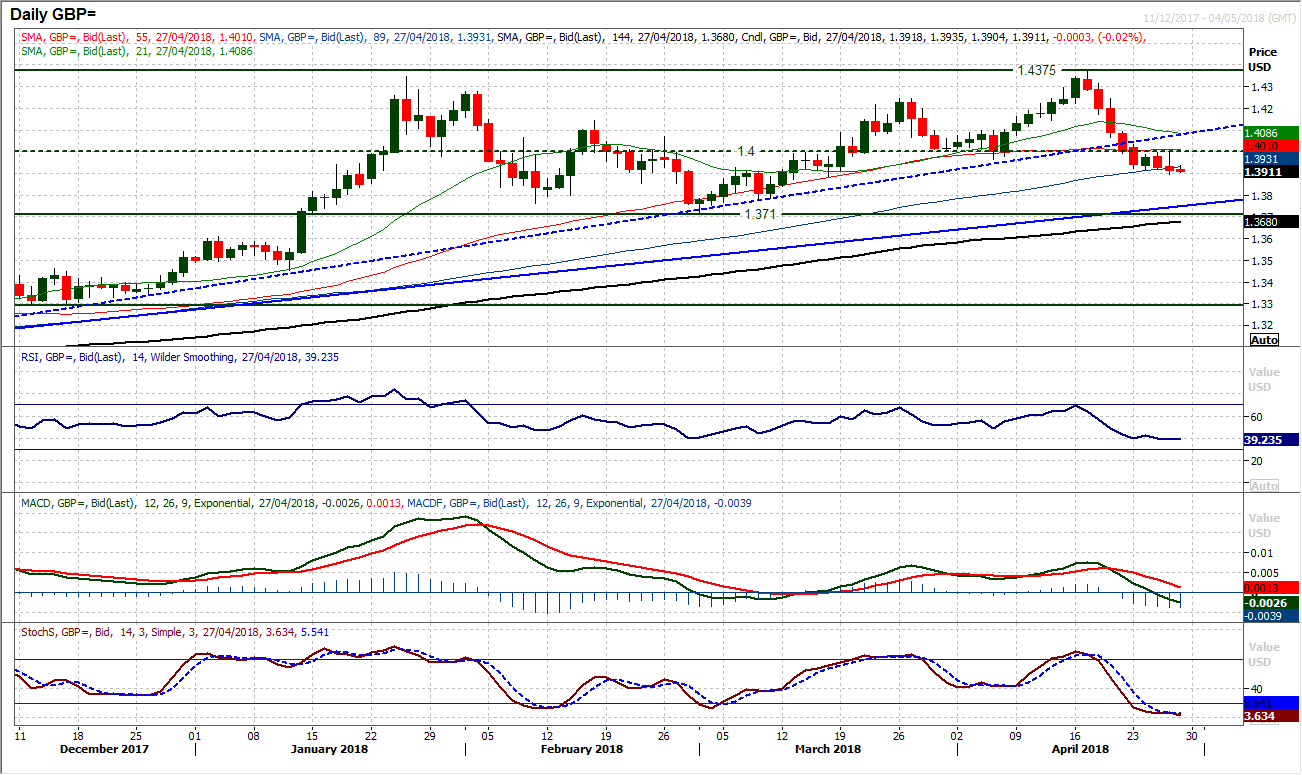
GBP/USD
Of the major pairs, aside from the dollar, sterling has actually been a decent performer in recent sessions, however, Cable remains under threat. Since breaking below $1.4000 earlier this week the old support has been tested as new resistance in each of the past three sessions. However this is clearly a level that the market is now seeing as a pivot and overhead barrier. Once more yesterday an intraday rebound failed at $1.4000 to turn lower. Despite this though, the selling pressure is not decisive and although the market closed lower yesterday there is a consolidation feel to trading in recent sessions. The RSI continues to hold up around 40 and although the Stochastics are in negative configuration (reflecting the sharp sell-off of last week), the MACD lines are drifting lower (rather than accelerating). There is clearly still a negative bias to the outlook and this will continue whilst resistance at $1.4000 remains intact, but the sellers are not having it all their own way as yet. Perhaps this will change with both the UK and US reporting GDP numbers today, so Cable will likely have extra volatility. Initial support at $1.3885 before $1.3780 and the key low at $1.3710. Above $1.4000 comes resistance at $1.4100 that needs to be overcome for a renewed positive outlook.
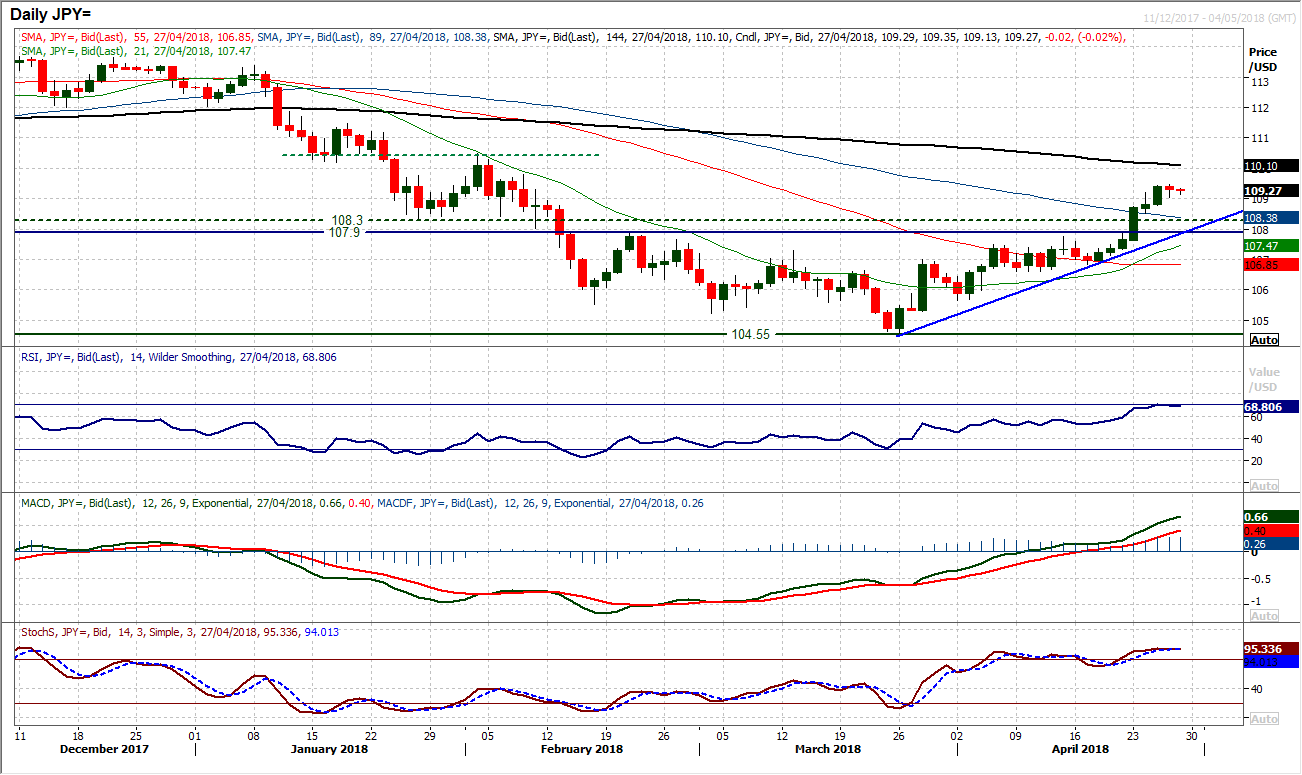
USD/JPY
The rally has just stalled a touch as the market formed a first mildly) negative candle for over a week. This stalling comes as the RSI has just peaked at just over 70 as the potential for a consolidation starts to build. It has been an impressive run and breakout in the past week but with momentum indicators looking stretched, a pause for breath could easily be seen. The uptrend comes in at 107.85 which is a confluence of support from the breakout at 107.90 and further support at 108.30. Corrections would still be seen as a chance to buy, with the market likely to continue to push on towards 110.50 in due course. The hourly chart shows strong near term momentum has ebbed away but as long as the hourly RSI does not drop under 40 then the bulls will still be happy. Very near term support at 108.85 whilst a move above 109.45 would renew positive momentum.
Gold
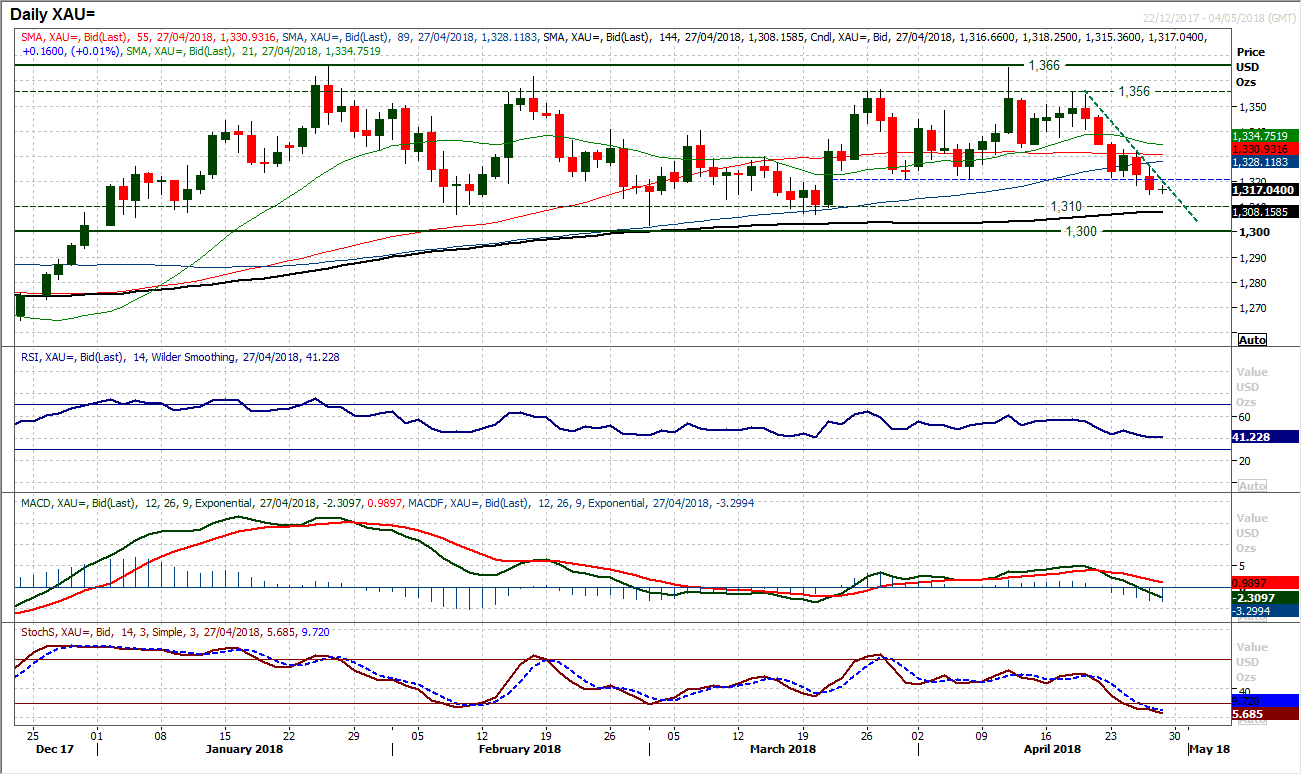
Gold has been testing the waters of the $1321 support recently and completed the near term break yesterday with a bear candle and closing breach. This has now opened a retreat back towards the key range lows at $1300/$1310 once more. Over the past week, gold has been under pressure and very near term momentum has deteriorated, however there is still no precipitous look to the momentum indicators, yet. The RSI is still hovering above 40 and the MACD lines are still around neutral. It is only really the sensitive Stochastics that are negatively configured. It does not suggest that the selling pressure have got a huge amount of weight behind it. The Support band $1300/$1310 has caught several corrections in recent months. The hourly chart shows a negative configuration in near term momentum, with a stepped decline leaving $1326.50 as resistance above the overhead supply of $1321. For now rallies are being sold into, with the hourly RSI failing around 60 and MACD lines failing around neutral. If this changes it could signal a recovery is starting to build.
WTI Oil
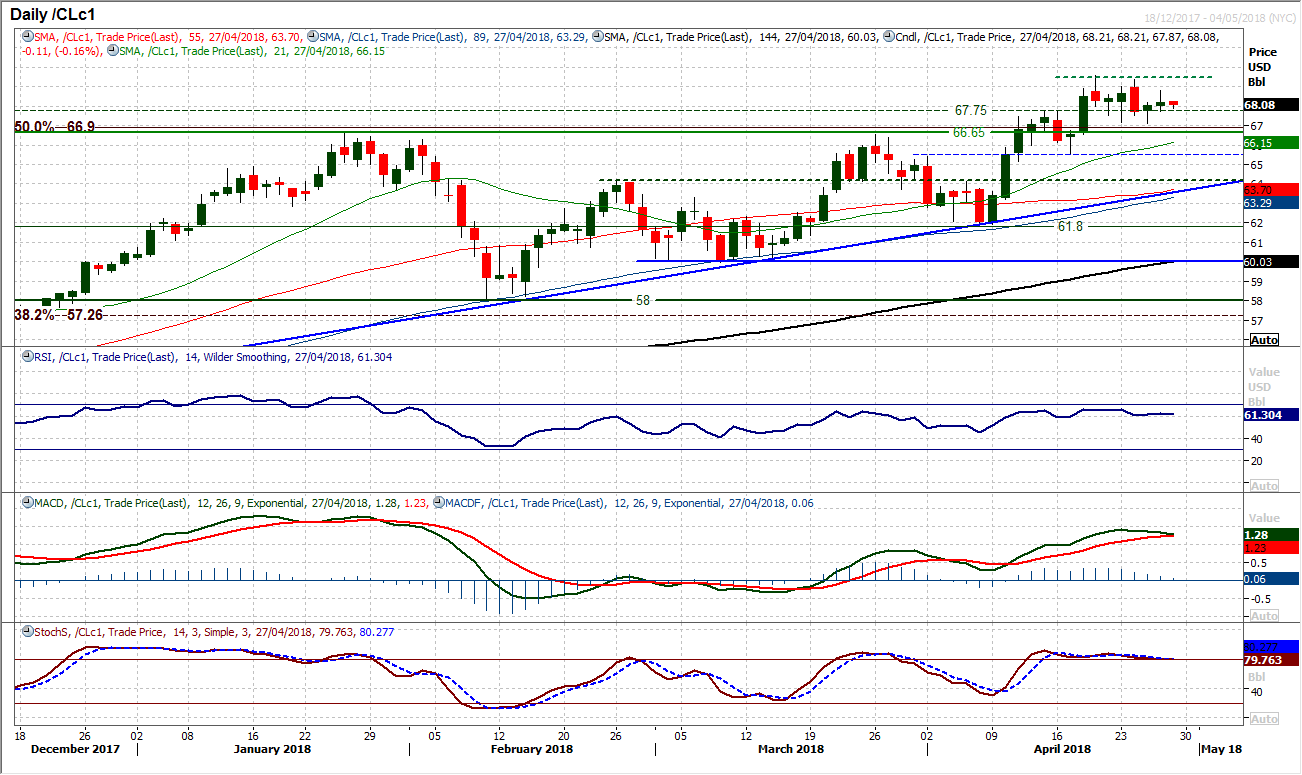
With a run of choppy, uncertain candles continuing and the market ranging in the past six sessions there is a consolidation underway. In the past week there has been a continued tendency for early session moves to be lost as long tails have been formed, both higher and lower. This reflects a lack of overall conviction in the market from one day to the next and also makes is difficult to trust any move that oil makes for now. Despite this, the market is still supported above $67.15 and there is a positive bias to momentum that reflects an outlook to buy into weakness. This will remain the case whilst trading above $65.55 but the old breakout highs at $66.65/$67.75 are still a near term basis of support. Resistance remains in place at $69.55 which protects the psychological $70.
Dow Jones Industrial Average
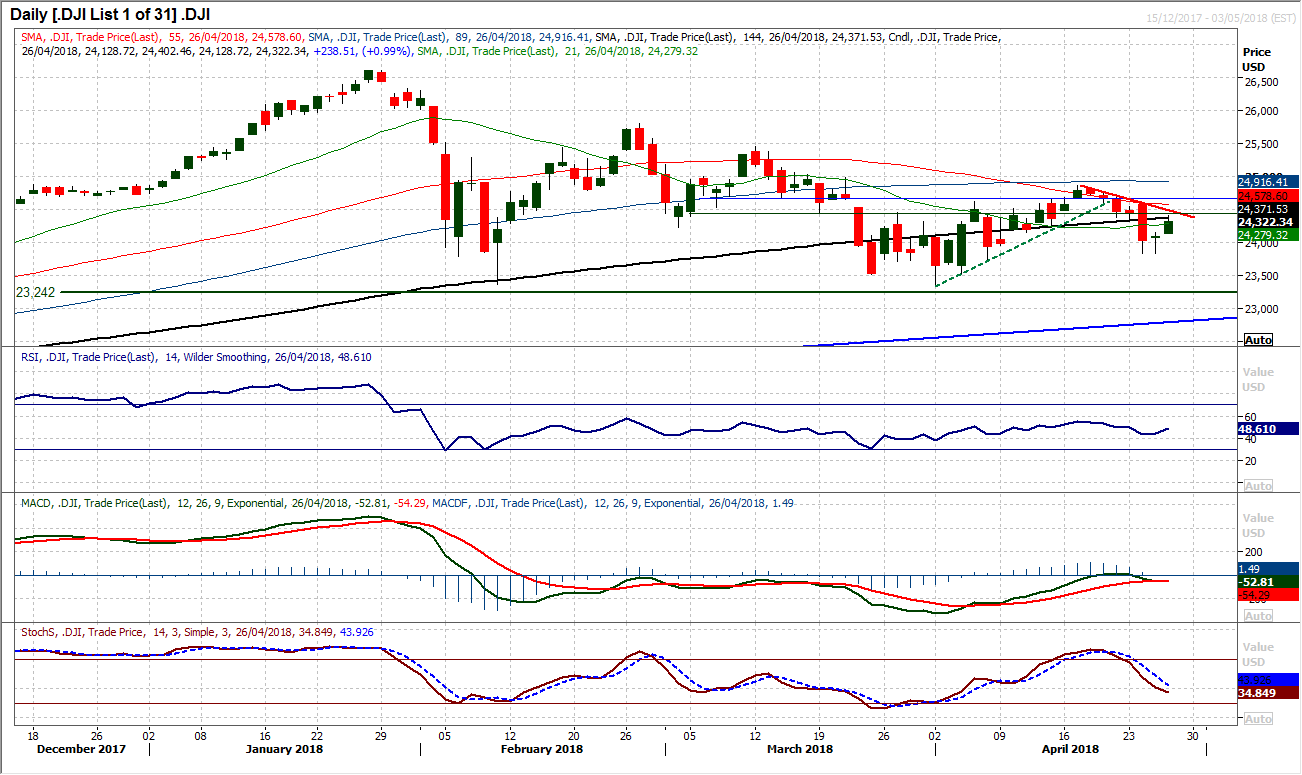
After the market picked up from the support around 23,825 on Wednesday, the bulls continued to rebound with a solid positive candle yesterday. However will it be anything more than just another rally that gets sold into? There is a growing downtrend that has formed over the past eight sessions which comes in at 24,435 today, which is interestingly around the bottom of the old pivot band 24,450/24,650. Momentum indicators remain correctively configured on a medium term outlook and as such the bulls have a lot of work to prevent this being another opportunity to sell. The key reaction high to overcome in order to confirm a break of this sequence is at 24,580 which has been the traded high this week.
Author

Richard Perry
Independent Analyst


