Flows into safe havens after Trump hints at 'phase one' deliverability concerns [Video]
![Flows into safe havens after Trump hints at 'phase one' deliverability concerns [Video]](https://editorial.fxstreet.com/images/Macroeconomics/Countries/America/UnitedStatesofAmerica/american-flag-waving-13352887_XtraLarge.jpg)
Market Overview
It would be nice if we did not have to start off every report talking about the trade dispute, but alas. Comments from Donald Trump at the outset of the NATO summit have again caused trades to draw a line through previous expectations of deliverability of a “phase one” agreement with China. Trump now says that a deal may not come before the (presidential) election. He has form in putting the cat amongst the pigeons just in front of an imminent deal, however, given the recent legislative moves from Congress, this has impacted on markets this time. Last week, he signed two bills regarding Hong Kong, which riled the Chinese. He now has a decision to make as whether to further stoke the tensions and sign a bill which is far more of a direct criticism of China, regarding the persecution of the Urghur Muslim minority. The deadline for the 15th December tariff increase looms large and the potential for a deal is dwindling. Safe haven flows have resulted in the US 10 year yield dropping by more than -10 basis points, whilst gold and the yen are also strengthening. Risk appetite has been slightly more settled overnight as the China Caixin services PMI improved to a 7 month high. However, caution comes with trading on Monday where manufacturing PMIs showed signs of improvement until the ISM data which hit sentiment in the afternoon. We must watch out for the ISM Non-Manufacturing data.
Wall Street was again sharply lower yesterday with the S&P 500 -0.7% at 3093, although this was way off the day lows. US futures have been stable early today, around flat currently. Asian markets played catch up on yesterday’s selling pressure, with the Nikkei -1.0% and Shanghai Composite -0.2%. European markets are mixed, with the FTSE futures cautious around flat, whilst DAX futures are higher by +0.3%. In forex, there is a mild risk aversion with AUD and NZD retracing recent gains, whilst JPY is outperforming USD slightly. In commodities we see gold continuing to climb by another +$5 whilst oil is also again steadily higher in front of the OPEC meeting tomorrow.
The outlook for services sectors of the major economies is the key focus today. Final Eurozone Services PMI is at 0900GMT and is expected to see the flash reading confirmed at 51.5 (which would be slightly down from the 52.2 in October). The final Eurozone Composite PMI is also expected to be confirmed at the flash of 50.3 (down from 50.6 in October). However given the final Manufacturing PMI was slightly upwardly revised on Monday, could there be a risk of an upside surprise? The UK Services PMI is at 0930GMT and is expected to be 48.6 (as the flash reading was) which would be down from the level of 50.0 in October. Into the European afternoon, the US ADP Employment change for November is expected to improve marginally to 140,000 (up from 125,000 in October). The key release of the day will be the US ISM Non-Manufacturing at 1500GMT which is expected to drop slightly to 54.5 (from 54.7 in October). This number will take special attention today given the significant negative reaction across markets to Monday’s surprise deterioration on the ISM Manufacturing. The Bank of Canada monetary policy decision is at 1500GMT and is expected to see no change at +1.75%, but focus will be on any potential guidance for a rate cut early in 2020. The EIA oil inventories are expected to show a drawdown of -1.8m barrels (after a build of 1.6m barrels last week).
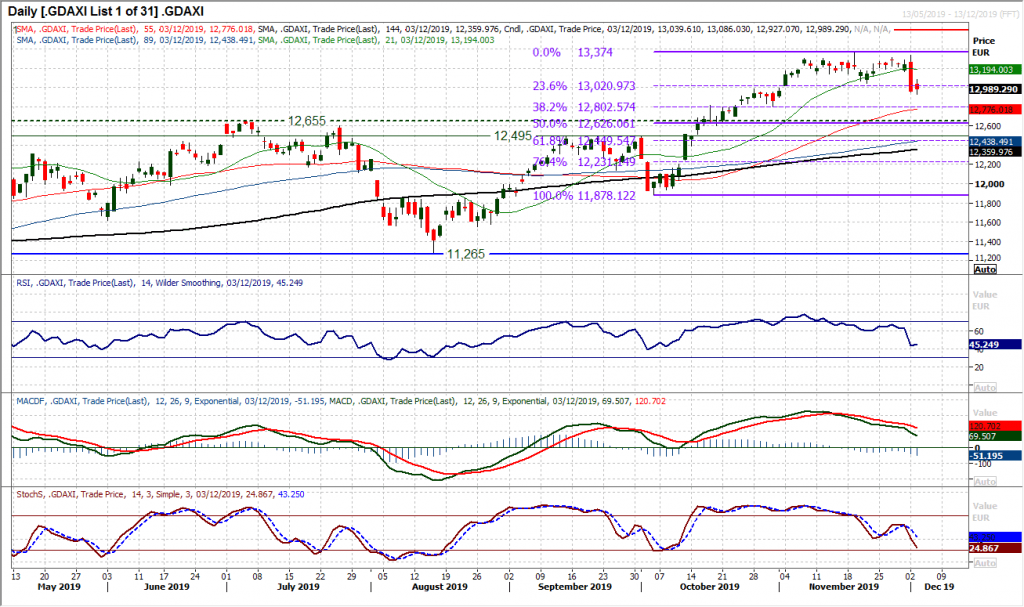
Chart of the Day – DAX Xetra (GER30)
We have been discussing prospective sell signals on the DAX for a few weeks now. A variety of mixed signals have subsequently been posted, but with Monday’s decisive bear candle we see the negative pressure mounting. The key question is whether this is a near term blip for another chance to buy, or is it the start of a deeper correction. Deteriorating near term momentum has been building, but it is remarkable how similar this phase of trading is with the late September early October sharp move lower. Two months ago, sharp bear candles were simply a quick shake out, however, it is notable that the bounce from 11,878 (in early October) was actually from a 50% Fibonacci retracement of the August/September rally. This time around, there has merely been an unwind to the 23.6% Fib level. There does look to be more room to unwind on the MACD lines (back to neutral) and RSI (back to 40). There is also a confirmed top pattern formed on a close below 13,045 which implies 330 ticks of correction back towards 12,715. There is a pivot line around 12,800 which is also the 38.2% Fib, whilst an unwind to 12,500/12,650 old highs would help to renew longer term upside potential. Resistance now sits at the 13,045 neckline up towards yesterday’s high around 13,085. If the bulls start to struggle again, it could be an opportunity.
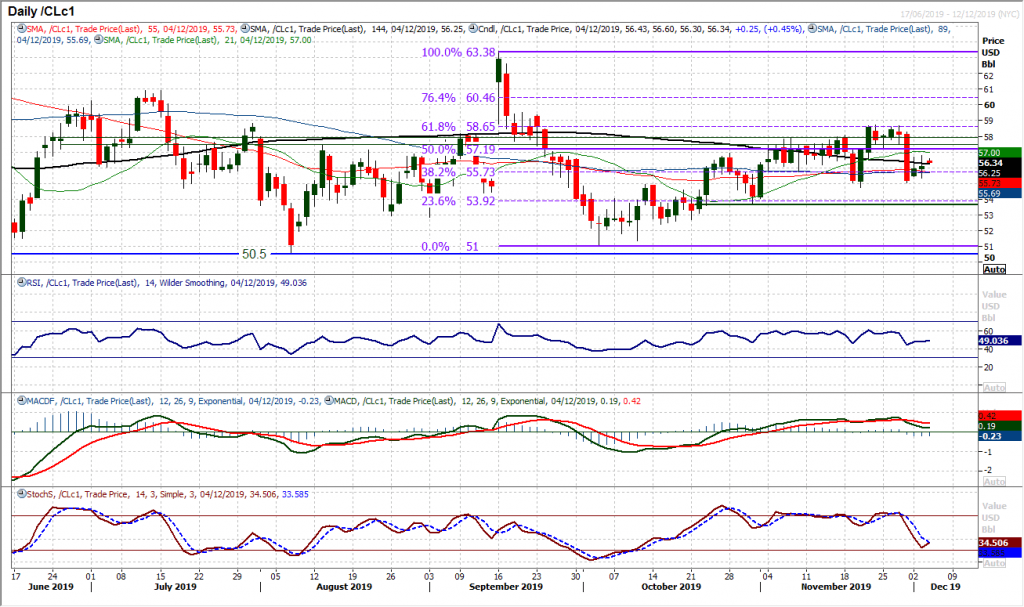
WTI Oil
We have a range of fundamental factors impacting across oil this week. Reaction to Trump’s comments on the trade dispute, reaction to OPEC supplies and also inventory levels. Technically though, the bulls have settled the market down with a couple of marginal positive sessions and the supports at $54.75/$55.00 are now firming. The sharp deterioration in momentum is bottoming out. On a technical basis, this is turning into rather a messy range in the past 4 to 5 weeks, generally trading around the 50% Fib retracement (of $63.40/$51.00) at $57.20 which seems to be something of a magnet. Perhaps more decisive direction will come in the wake of the OPEC decision, but for now there is a mild edge higher back towards the 50% Fib again.
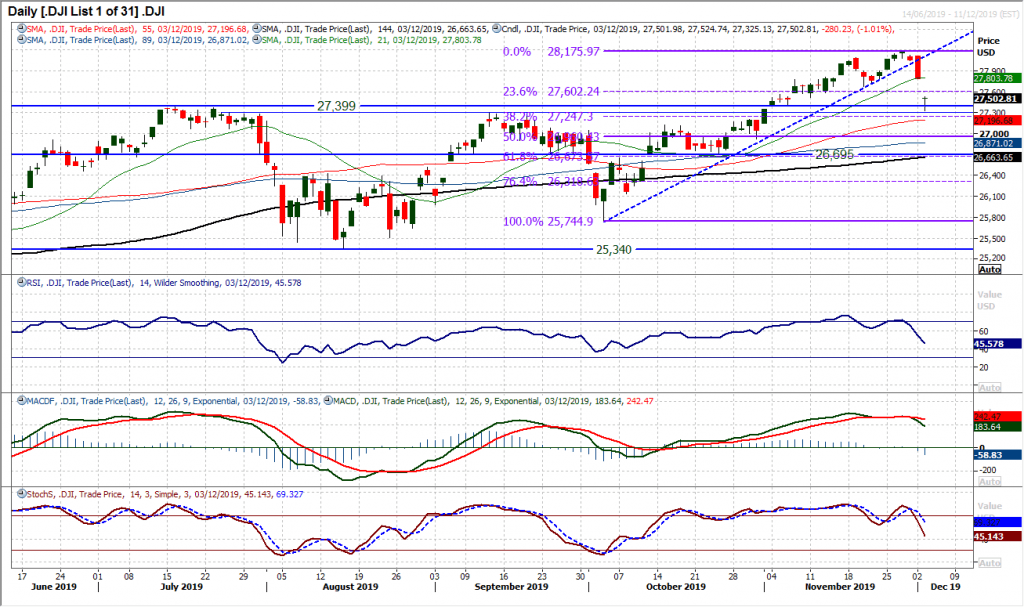
Dow Jones Industrial Average
Investors have clearly been rattled by what has been a significant re-assessment of the US/China trade negotiations in recent days. The result has been a sharp retracement on the Dow. Having hit a high of 28,175 last week, there has been a big bear candle followed by a massive downside gap for yesterday’s session. The question is just how far the move goes. We still see this as a near term retracement of the bull run from 25,340 to 28,175. We discussed previously the importance of the breakout support band 27,310/27,399 and is was interesting to see an intraday low yesterday at 27,325 before bouncing to form an almost perfect “long legged doji” candle. This suggests dissipating selling pressure. There is a big gap to fill now at 27,782 (around +1% higher from here). Clearly though, for now, momentum indicators are on the downswing and there needs to be a degree of control of stability and balance that the buyers get back first. We continue to see near term corrections as a medium term buying opportunity. Resistance is initially with the 23.6% Fib level of the rally around 27,600.
Author

Richard Perry
Independent Analyst


