Finally, the House of Representatives passed the economic stimulus package

Good Morning Traders,
As of this writing 5:25 AM EST, here’s what we see:
US Dollar: June USD is Up at 98.800.
Energies: April'20 Crude Down at 20.41.
Financials: The June'20 30 year bond is Up 79 ticks and trading at 181.17.
Indices: The March S&P 500 emini ES contract is 40 ticks Lower and trading at 2514.00.
Gold: The April '20 Gold contract is trading Down at 1649.10. Gold is 50 ticks Lower than its close.
Initial Conclusion
This is a nearly correlated market. The dollar is Up+ and Crude is Down- which is normal and the 30 year Bond is trading Higher. The Financials should always correlate with the US dollar such that if the dollar is lower then bonds should follow and vice-versa. The S&P is Lower and Crude is trading Lower which is not correlated. Gold is trading Lower which is correlated with the US dollar trading Up. I tend to believe that Gold has an inverse relationship with the US Dollar as when the US Dollar is down, Gold tends to rise in value and vice-versa. Think of it as a seesaw, when one is up the other should be down. I point this out to you to make you aware that when we don't have a correlated market, it means something is wrong. As traders you need to be aware of this and proceed with your eyes wide open.
At this time all of Asia is trading Lower. All of Europe is trading Lower as well.
Possible Challenges To Traders Today:
Pending Home Sales m/m is out at 10 AM. This is Major.
Lack of Major economic news.
Treasuries
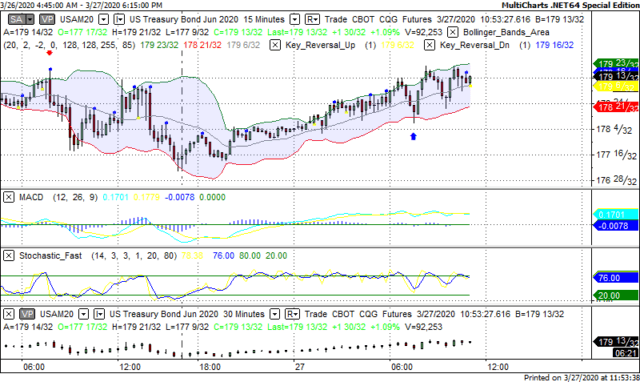
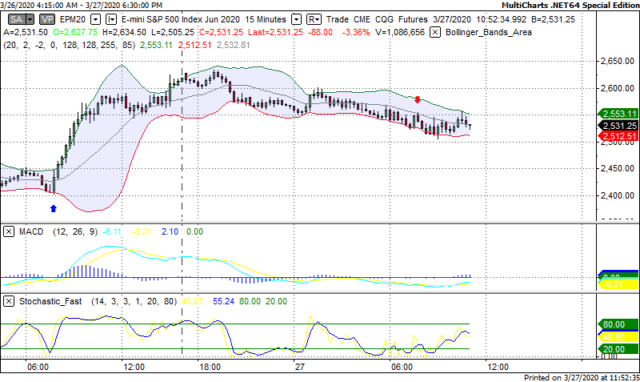
We've elected to switch gears a bit and show correlation between the 30 year bond (ZB) and The S&P futures contract. The S&P contract is the Standard and Poor's and the purpose is to show reverse correlation between the two instruments. Remember it's liken to a seesaw, when up goes up the other should go down and vice versa.
Yesterday the ZB made a move at around 8 AM EST. The ZB hit a Low at around that time and the S&P moved Lower. If you look at the charts below ZB gave a signal at around 8 AM and the S&P moved Lower at around the same time. Look at the charts below and you'll see a pattern for both assets. ZB hit a Low at around 8 AM EST and the S&P was moving Lower shortly thereafter. These charts represent the newest version of MultiCharts and I've changed the timeframe to a 15 minute chart to display better. This represented a Long opportunity on the 30 year bond, as a trader you could have netted 30 plus ticks per contract on this trade. Each tick is worth $31.25. Please note: the front month for the ZB is now June '20. The S&P contract is now June '20 as well. I've changed the format to Renko bars such that it may be more apparent and visible.
Charts Courtesy of MultiCharts built on an AMP platform.
Bias
On Friday we gave the markets a Downside bias as both the USD and the Bonds were trading Higher Friday morning and this generally reflects a Downside day. The markets didn't disappoint as the Dow dropped 915 points and the other indices lost ground as well. Today we aren't dealing with a correlated market and our bias is Neutral.
Could this change? Of Course. Remember anything can happen in a volatile market.
Commentary
So the House of Representatives passed the economic stimulus package, the President signed but the markets dropped with the Dow losing 915 points. How could this be? Unfortunately this didn't happen until late in the day and by that time it was too late to reverse course and direction. One item worth noting is the reason why the Congress persons were summoned back to DC. A heretofore unknown GOP Congressman from Kentucky (Thomas Massie) decided to get on his soapbox and preach the virtues of NOT approving this bill as it comes with a 2 trillion dollar price tag. Has this guy been living under a rock for the last two weeks? Isn't he aware that 3.5 million Americans had to file for unemployment in less than one week? That's worse than the Great Depression. President Trump has suggested that he should be thrown out of the Republican party. I say why stop there? Throw him out of politics altogether.
Author

Nick Mastrandrea
Market Tea Leaves


