Fed: Tapering in November seems like a done deal
Inflation is surging and consumers’ inflation expectations are doing the same. The FOMC minutes show that the central bank finally accepted reality.
With inflation running hot and another month on the books, I wrote on Sep. 15 that another headline Consumer Price Index (CPI) print of roughly 5.25% to 5.75% should hit the wire when the data is released on Oct. 13. And with the headline CPI increasing by 5.4% year-over-year (YoY) in September, inflation is still running 2.7x the Fed’s annual target.
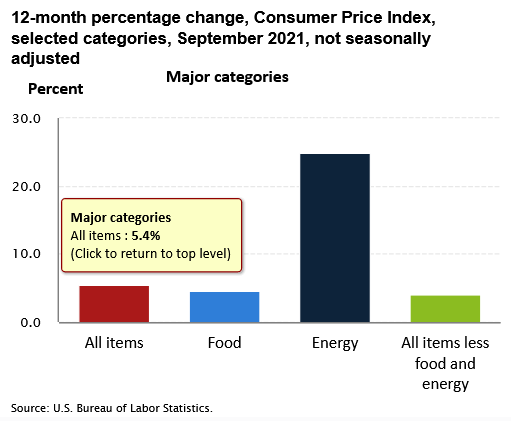
In addition, while I’ve been warning for months that rent inflation should make its presence felt during the autumn months, the Shelter CPI increased by 3.2% YoY in September – the highest YoY percentage increase so far in 2021.
Source: U.S. Bureau of Labor
Statistics (BLS) More importantly, though, the FOMC released the minutes from its September 21/22 policy meeting on Oct. 13. And while the group essentially admitted its 2021 error, officials reiterated their expectations that “this year’s rise in inflation would prove to be transitory.”
However, highlighting the FOMC’s (stag) inflationary anxiety, the report revealed:
“The staff continued to judge that the risks to the baseline projection for economic activity were skewed to the downside. In particular, the future course of the pandemic was seen as an important source of downside risk. The staff also continued to judge that the risks around the inflation projection were tilted to the upside, with the possibility of more severe and persistent supply issues viewed as especially salient. In addition, the staff pointed to a risk that longer-run inflation expectations would move appreciably higher and lead to persistently elevated inflation.”
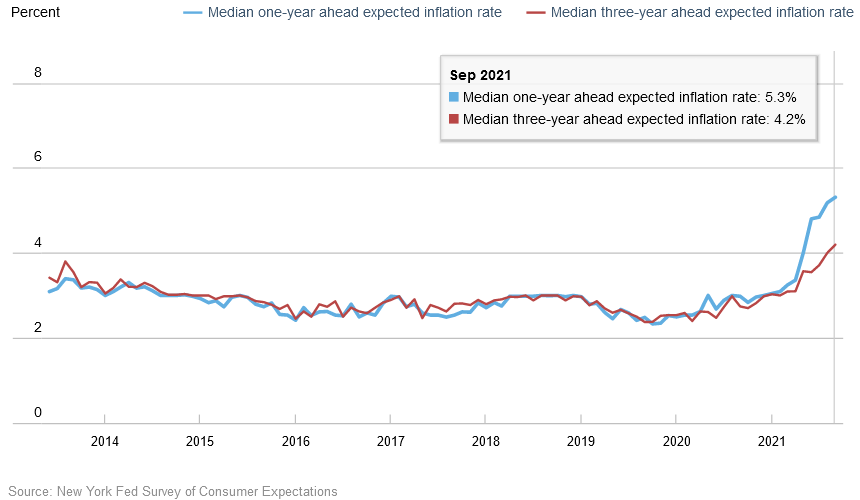
Speaking of “inflation expectations,” the New York Fed released its Survey of Consumer Expectations on Oct. 12. And while imploring that five-year inflation expectations remain “well-anchored,” the report revealed:
“Median short-term (one-year-ahead) inflation expectations increased by 0.1 percentage point in September to 5.3%, the eleventh consecutive monthly increase and a new series high since the inception of the survey in 2013. Median medium-term (three-year-ahead) inflation expectations also increased, to 4.2% from 4.0%, representing the third consecutive monthly increase and a new series high.”
November to remember?
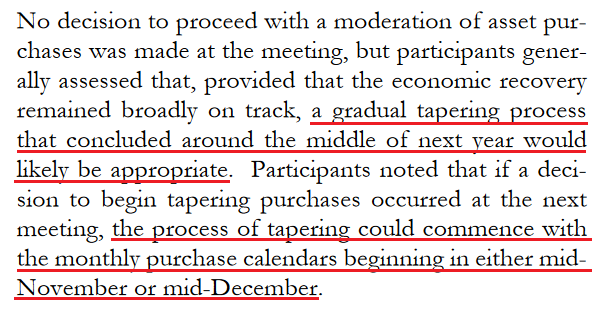
Furthermore, with inflation (as well as consumers’ inflation expectations) surging and the Fed’s largesse only exacerbating the problem, the central bank seems to have finally accepted reality. To explain, the FOMC minutes revealed that a November taper announcement is likely a done deal. And with that, a “gradual” taper that formally begins in “either mid-November or mid-December” is profoundly bullish for the U.S. dollar.
Source: U.S. Fed
For context, a taper that ends “around the middle of next year” is not “gradual.” The pace is faster than currently expected and also exceeds the precedent set in 2013. To that point, while the performances of the EUR/USD and the USD Index on Oct. 13 didn’t reflect this reality, neither move has fundamental foundations.
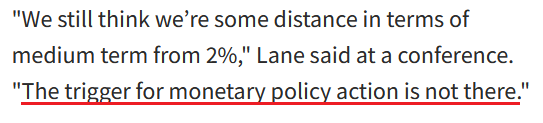
To explain, with the Fed essentially announcing the death of QE on Oct. 13, a profound monetary divergence will likely unfold over the medium term with significant implications for gold and silver. For example, with the Fed closing in on a taper announcement, ECB Chief Economist Philip Lane said on Oct. 11 that “we need to be much less trigger happy, we need to wait for data.” As a result:
Source: Reuters
Thus, with the Fed’s policy shift poised to usher the Fed/ECB ratio back to (or near) its 2019 lows, the EUR/USD – which accounts for nearly 58% of the movement of the USD Index – has to defy fundamental and historical precedent to move higher.
For example, the Fed/ECB ratio – which measures the relative money printing of the two central banks – stands at roughly 1.02. And since 2015, if we exclude the EUR/USD’s outlier strength in 2017-2018, when the Fed/ECB ratio sunk below 1, the EUR/USD spent most of its time in the 1.100 to 1.150 range. Moreover, when the Fed/ECB ratio sunk to an all-time low of 0.81 in September 2019, the EUR/USD closed the week trading at 1.1029.
What’s going on, Germany?
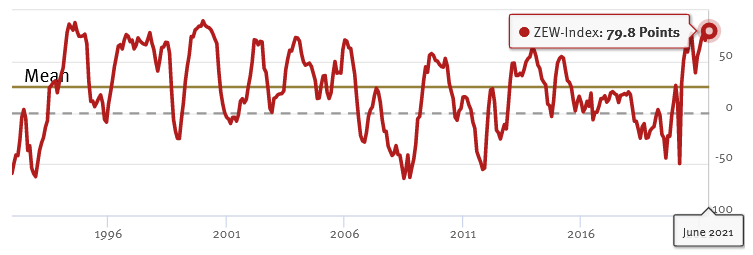
Also supporting a dovish ECB, German economic confidence sunk to a five-month low on Oct. 12 and Germany is Europe’s largest economy. To explain, I wrote on Jun. 9 and updated monthly:
While investors continue to buy hope and sell reality, rather than rising to 86.0 (the consensus estimate), the German ZEW Economic Sentiment Index (released on Jun. 8) fell from 84.4 in May to 79.8 in June.
Source: ZEW
To explain, the red line above tracks the German ZEW Economic Sentiment Index. If you analyze the behavior, you can see that 79.8 is still well above its historical average. More importantly, tough, notice how abnormally high readings are often followed by swift reversions? And with the prior high (84.4) only superseded by 2000, there is an awful lot of optimism already priced into the EUR/USD.
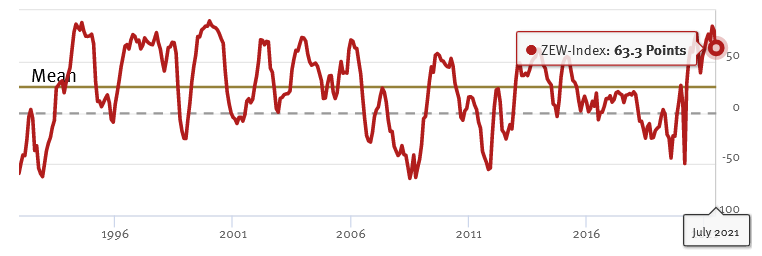
To that point, if we fast forward to Jul. 6, the German ZEW Economic Sentiment Index sunk to 63.3. And following right along, the EUR/USD ended the Jul. 6 session at its lowest level since Mar. 24.
Source: ZEW
Now, with August’s reading falling off a cliff, the German ZEW Economic Sentiment Index (released on Aug. 10) fell to 40.4 – its lowest level since November 2020.
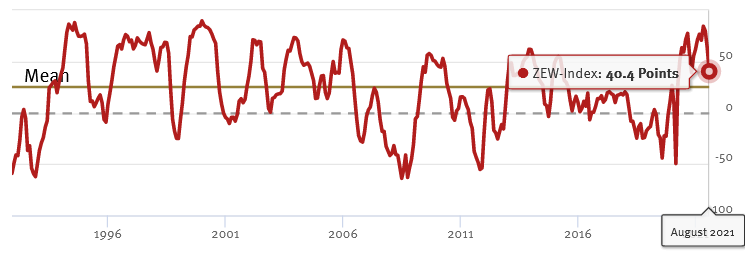
Source: ZEW
And with another month on the books and another new low, the German ZEW Economic Sentiment Index (released on Sep. 7) fell to 26.5 – its lowest level since coronavirus-induced lockdowns plagued the region in March 2020.
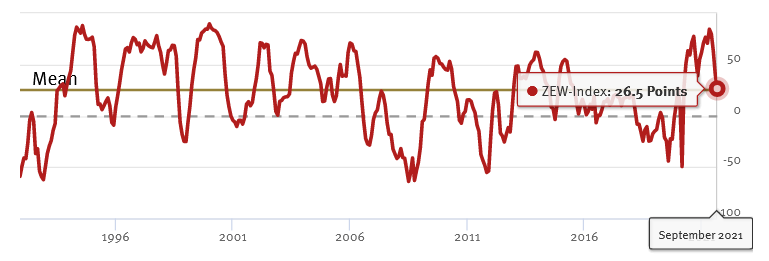
Source: ZEW
And sounding like a broken record, the German ZEW Economic Sentiment Index (released on Oct. 12) made another 2021 low (at 22.3).

Source: ZEW
ZEW President Professor Achim Wambach provided the following context:
“The economic outlook for the German economy has dimmed noticeably. The further decline of the ZEW Indicator of Economic Sentiment is mainly due to the persisting supply bottlenecks for raw materials and intermediate products. The financial market experts expect profits to go down, especially in export-oriented sectors such as vehicle manufacturing and chemicals/pharmaceuticals.”
The Eurozone still behind the US
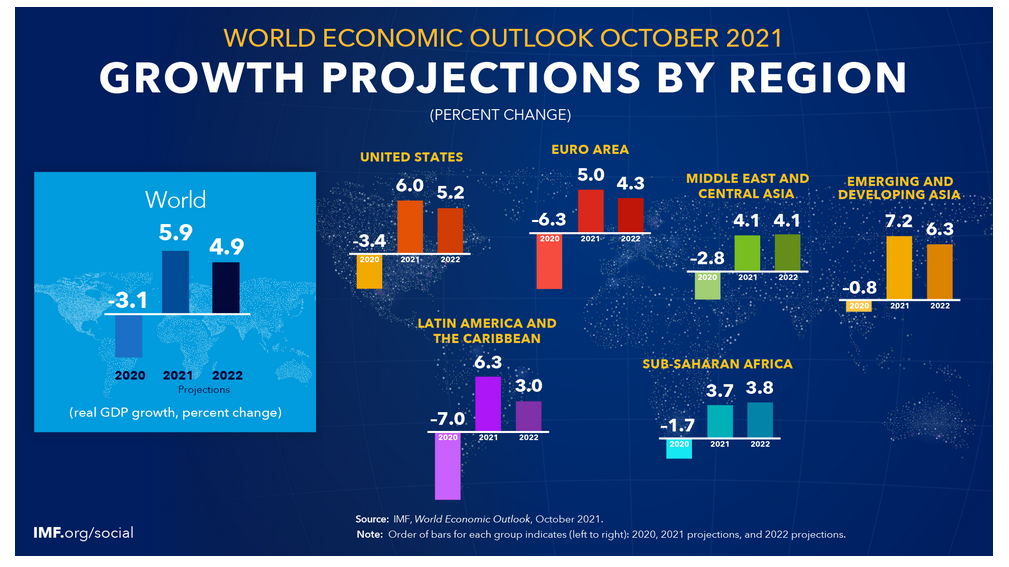
If that wasn’t enough, the International Monetary Fund (IMF) released its latest World Economic Outlook report on Oct. 12. And while changes from the group’s July projections left the Eurozone as a net-gainer over the U.S., the latter’s real GDP growth is still expected to outperform the former in 2021 and 2022.
Even more relevant, market participants expect the Fed to normalize its policy well in advance of the ECB.

Source: IMF
To explain, the chart on the left is where you should focus your attention. The blue line above (U.S.) tracks the expected path of the federal funds rate per the futures market, while the red line above (Eurozone) tracks the expected path of the euro interbank offered forward rate. If you analyze the profound divergence, you can see that the Eurozone overnight lending rate is expected to remain negative well into 2024 and beyond. Conversely, U.S. liftoff is expected near the end of 2022, with further rate hikes commencing thereafter.
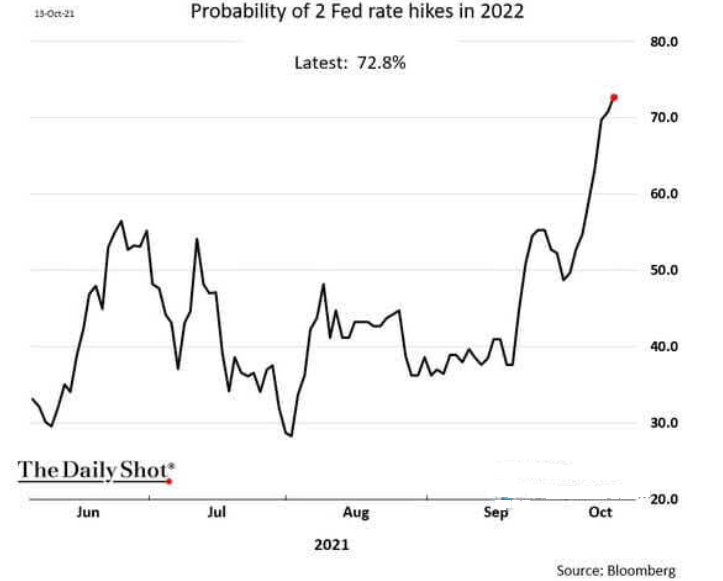
As further evidence, the probability of the Fed announcing two rate hikes in 2022 has recently spiked and is now approaching 73%.
The bottom line? The EUR/USD is materially overvalued relative to Eurozone-U.S. growth, liquidity and interest rate expectations. And with the currency pair responsible for the bulk of the USD Index’s fundamental movement, a material re-rating should uplift the dollar basket over the medium term. And with gold, silver and mining stocks often moving inversely to the U.S. dollar, a stronger greenback will likely weigh on the PMs during the autumn months.
In conclusion, the PMs rallied on Oct. 13, with a weaker USD Index and mixed U.S. Treasury yields helping to underwrite the daily optimism. However, with the latter poised to move higher over the medium term, the strength of the PMs’ upswings on Oct. 13 are cautionary tales of how violent the reversals could be once sentiment shifts. As a result, the PMs’ countertrend rallies will likely fizzle out and their medium-term downtrends should continue over the next few months.
Want free follow-ups to the above article and details not available to 99%+ investors? Sign up to our free newsletter today!
Want free follow-ups to the above article and details not available to 99%+ investors? Sign up to our free newsletter today!
Author

Przemyslaw Radomski, CFA
Sunshine Profits
Przemyslaw Radomski, CFA (PR) is a precious metals investor and analyst who takes advantage of the emotionality on the markets, and invites you to do the same. His company, Sunshine Profits, publishes analytical software that any


