Fed speakers dovish narrative despite positive data, markets cautious

Market Overview
The US dollar has regained some strength once more as day to day US economic data continues to question the apparent insistence of Fed speakers that rate cuts are necessary. Retail Sales and Industrial Production yesterday once more added some wind back into the sails of the dollar bulls. However, whilst this gives the dollar a near term boost, it will do little to change the outlook of the Fed which has become notably more dovish recently. Fed chair Powell once more reiterated that the FOMC would “act as appropriate”, whilst voting dove on the committee Charles Evans talked about a 50bps cut to help stoke the fires of inflation. It seems to be that the US dollar (and more broadly major currency pairs) will be somewhat rangebound in front of the crucial FOMC meeting at the end of the month. How the FOMC communicates its rate cut (and potentially further cuts to come) will be the outlook defining moment. Whilst other major pairs range, we do however still have trending direction on Cable, with sterling falling to more than two year lows against the dollar yesterday. The battle to be the new Conservative Prime Minister has brought the two candidates to make increasingly more hard line stances on Brexit. The latest move to talk of scrapping the Irish backstop is conceivably a non-runner for the EU-27 and means that a push towards a “no deal” Brexit is an ever more stark reality. Sterling breaking down is a reflection of the market’s view of the impact of this.
The Wall Street rally into new highs has just hit the buffers for now as the S&P 500 fell by -0.3% to 3004 last night. US futures are a touch more stable this morning, a shade higher at +0.1%. However, this has still dragged on Asian markets with the Nikkei -0.2% and Shanghai Composite -0.1%. European indices are also once more starting the day in cautious mode, with the FTSE futures -0.2% and DAX futures -0.1%. In forex, there is little real move across the G4 majors, whilst the continued positive performance of NZD is notable. In commodities, the slip on gold is holding, whilst oil has started to see a degree of support after yesterday’s strong decline.
On the economic calendar, the second of the three tier one UK data releases this week comes in the form of inflation for June. UK CPI at 0930BST is expected to show headline CPI remaining at +2.0% (+2.0% in May) whilst core CPI is expected to tick higher to +1.8% (from +1.7%) and back in the direction of the Bank of England’s 2% target. The final Eurozone inflation for June is at 1000BST which is expected to show no change from the headline HICP at +1.2% (+1.2% flash, +1.2% final in May), with core HICP also remaining at +1.1% (+1.1% flash, +0.8% final May). Later in the session, the US data is at 1330BST with Building Permits for June which is expected to increase marginally to 1.300m (from 1.299m), with Housing Starts expected to slip slightly to 1.261m (form 1.269m in May. EIA oil inventories are at 1530BST and are expected to show another drawdown on weekly crude stocks by -3.4m barrels (-9.5m barrels last week) with distillates building by +0.4m barrels (+3.7m last week) and gasoline in drawdown by -1.9m barrels (-1.5m last week).
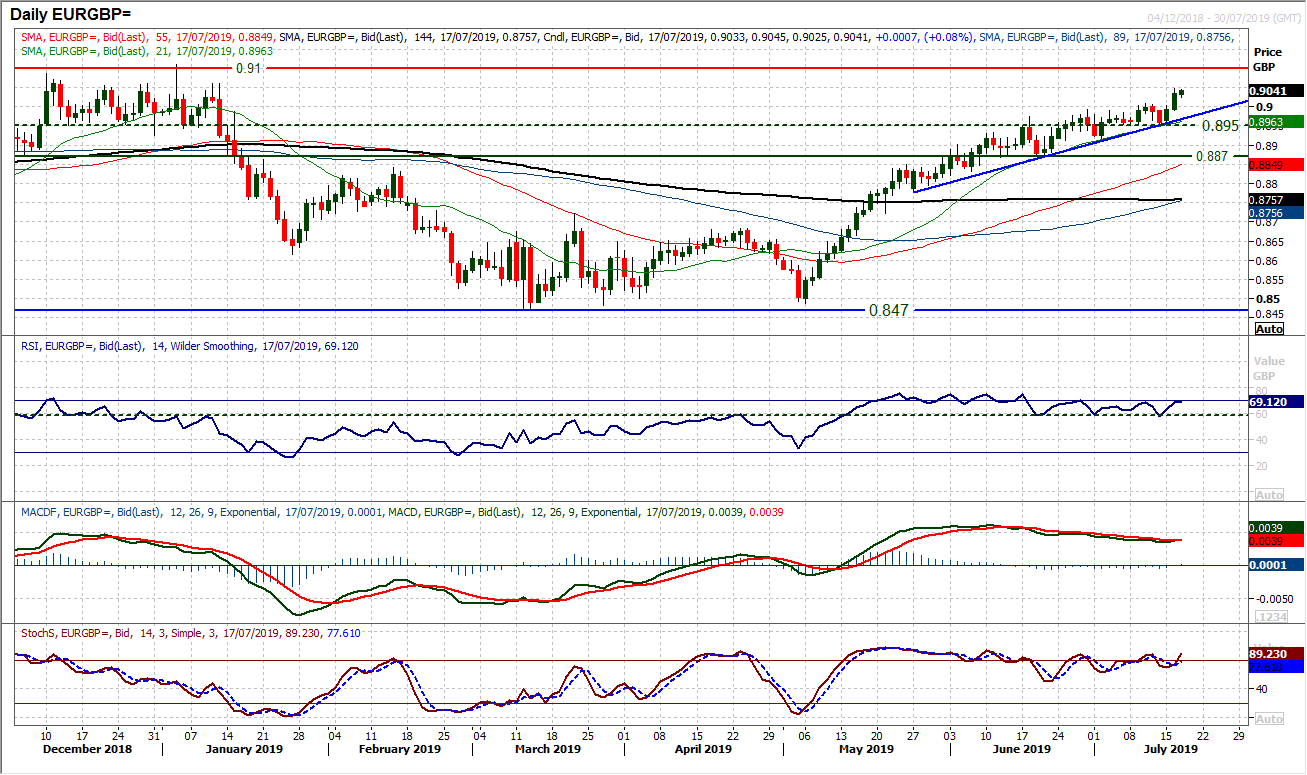
Chart of the Day – EUR/GBP
Sterling is plumbing the depths once more as the prospect of a “no deal”/disorderly Brexit becomes an ever greater probability. Euro/Sterling has been solidly pulling higher over the past couple of months as the market has become ever more sterling bearish. However, this move has taken a big step forwards on yesterday’s move and the crucial resistance at £0.9100 is once more into view. Momentum indicators have been solidly positively configured and continue to suggest buying EUR/GBP into weakness. The latest breakout above £0.9010 means there is now a strong buy zone between £0.8975/£0.9010 now. There is minor resistance from the December/January trading range at £0.9060 but the big test will come at £0.9100 now. The strength of the RSI and Stochastics suggest there is further upside potential in this breakout. But also the hourly chart shows a stretched near term position. Any near term unwind in the coming days which finds support £0.8975/£0.9010 would be that chance to buy. The latest higher low at £0.8950 is now key support.
Having looked to build a promising recovery, just over a day or so later and the euro is back under pressure again. What had looked to be a neutralised outlook, is now beginning to lean negative once more. There is an important band of support at $1.1180/$1.1190 which were two lows from June and earlier in July, which the bulls have to protect now. Yesterday’s decisive negative candle has made this job harder. Momentum indicators have backed off into a deteriorating configuration once more as the MACD lines edge lower and Stochastics roll over. Watching the RSI will be key though. The RSI held above 38/40 for almost three months now as the market has looked to build support. It is currently in the low 40s, but this would certainly be a bearish signal if it went below 38/40. The initial response from the bulls has been encouraging early today, but the hourly chart shows the need to move back above a near term pivot at $1.1235 to improve the outlook again. If not then the move will be seen as a chance to sell again but simply with renewed downside potential.
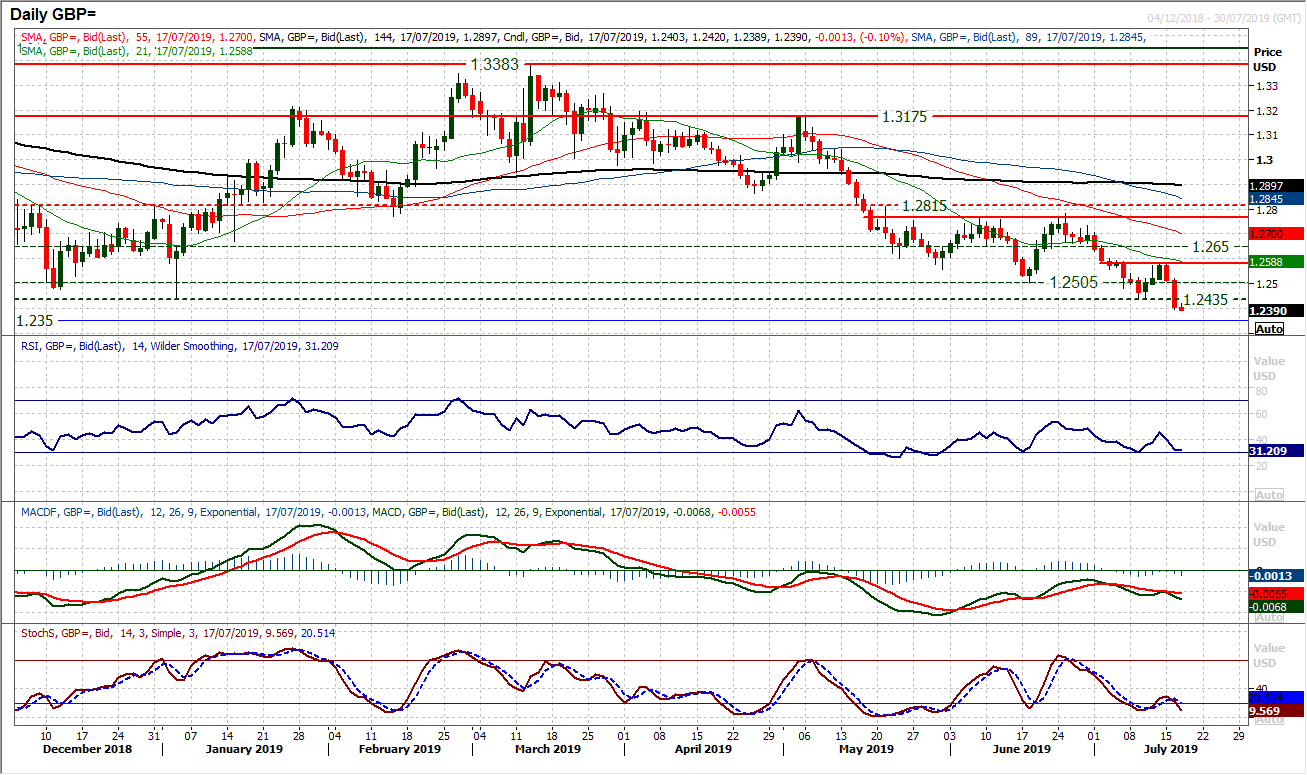
The past few months have been a barrage of lower highs and lower lows on Cable. Sterling is stuck as a huge underperformer and the latest decisive bear candles have seen the market falling to new multi-year lows. A breach of last week’s lows at $1.2435 has opened the low $1.20s with the next support at $1.2350 from April 2017 and then down at $1.2100. Momentum is in clear negative configuration, with the Stochastics again swinging lower and a “bear kiss” on MACD lines. The RSI still has downside potential too, with sell-off usually seeing 30 hit (currently around 33). Whilst a technical rally cannot be ruled out, selling into strength is the play here. There is resistance of overhead supply in the band $1.2435/$1.2505 which is now a near term sell zone. The resistance at $1.2580 becomes a key lower high now.
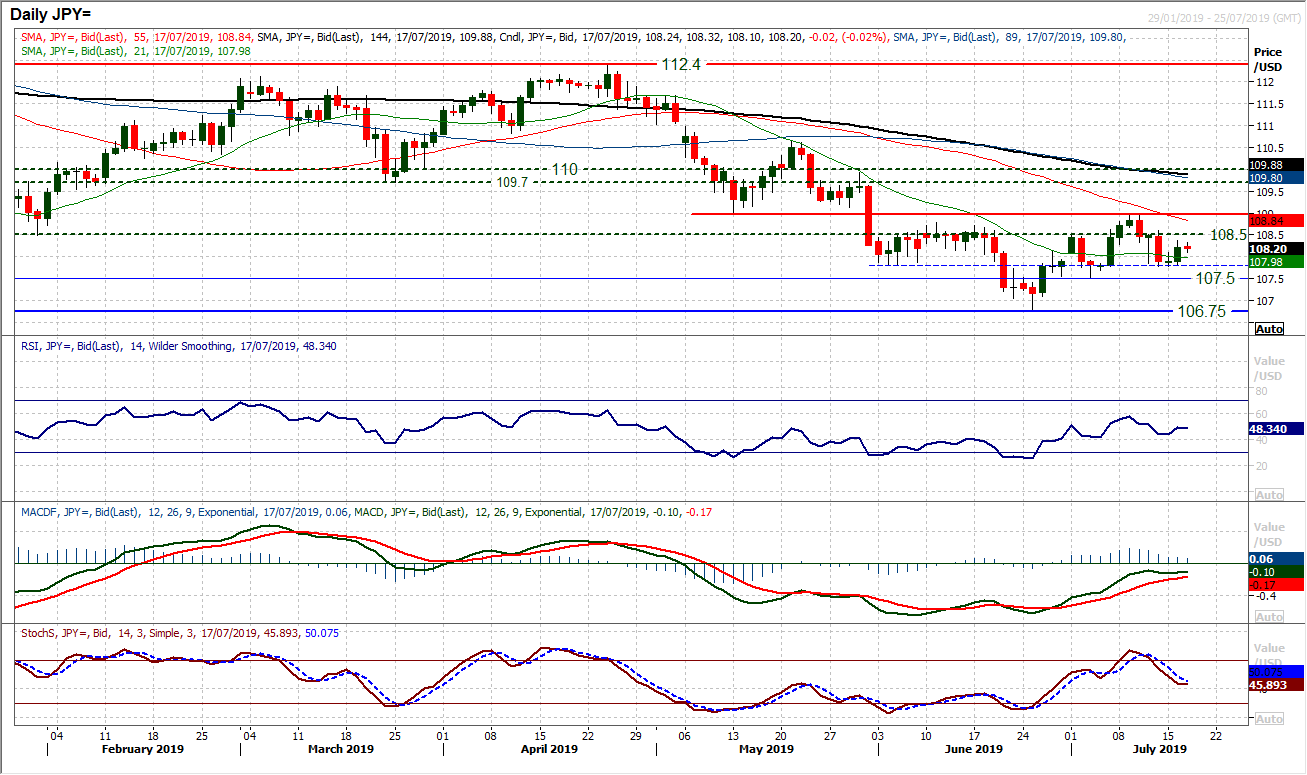
The dollar recovery of the past couple of sessions has allowed a basis of support to form around 107.80. The fact that the daily lows of each of the past four completed sessions have all come within 7 pips around 107.80 just adds importance to this support now. It also strengthens the support of the high low at 107.50. We have been discussing the bull failure and resistance in the band 108.50/109.00, but equally, the dollar bulls will be encouraged by the support that the market is also building. Momentum indicators are subsequently beginning to form holding patterns. The RSI is hovering a shade under 50, MACD lines a shade under neutral and even Stochastics shallowing their slide. This reflects the market consolidation within a medium term negative outlook. There is a growing range in play as the 21 day moving average has flattened. Trading between 106.75/109.00. The hourly chart is neutrally configured on momentum indicators. Initial resistance at 108.60 is important now as a gauge for the bulls to gain confidence.
Gold
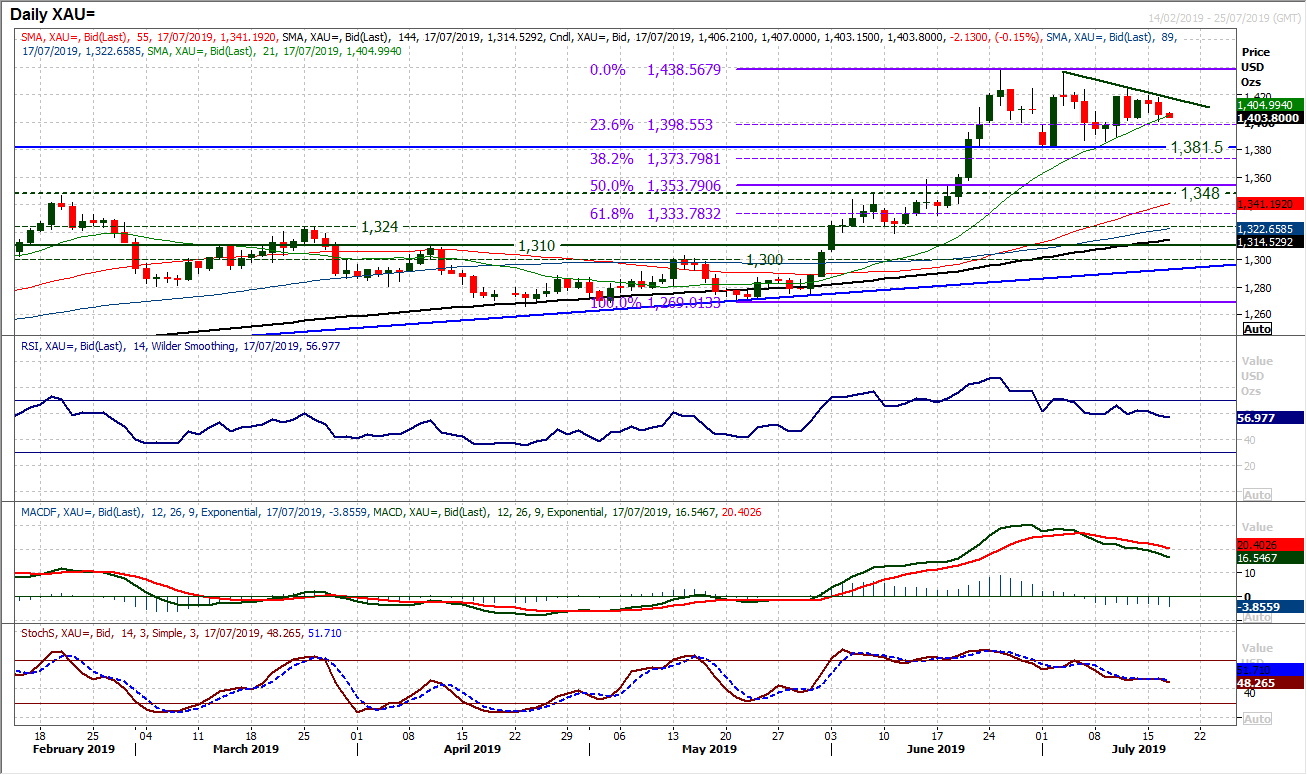
The consolidation of gold continues to build as the market has slipped back into the $1400/$1410 band. However, the last couple of sessions of mild decline reflect the gains on the dollar. Taking a step back, gold is mid-range between the key support at $1381.50 and the recent high at $1439. The slip in the past couple of sessions is beginning to weigh slightly on momentum, with RSI under 60, MACD lines still in decline and Stochastics just shading lower. For now this is part of an unwind in a calm drift back and ultimately should help the move to renew upside potential. However, the bulls will be keen to hold on to support around a pivot a t $1400 and the $1399 (23.6% Fibonacci retracement) help to maintain what is a positive outlook. Losing this would put the bottom of the range at $1381.50 back under threat and a potential top pattern again.
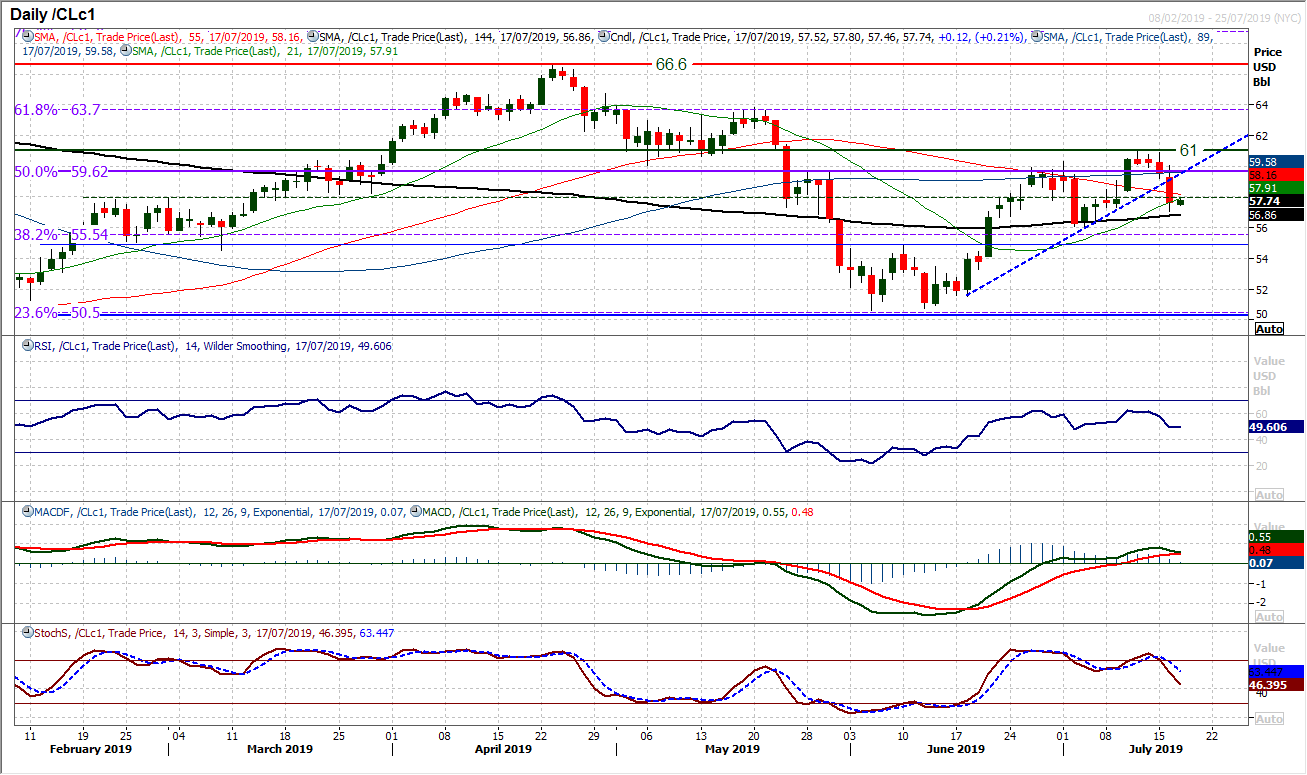
WTI Oil
The chart of oil from yesterday shows that keeping on top of the newsflow remains important. Suggestions that the US and Iran tensions could be easing, to cause a sharp drop and damage to the improving technical outlook. The strong bear candle has broken the support of the four week uptrend, but also back below the pivot at $58.00. Momentum signals have taken a turn for the worse, with especially the Stochastics dropping sharply. Watch the RSI which is back at 50, if this moves into the mid-40s then the key higher low at $56.05 will come under pressure. The MACD lines are also close to a bear cross. It means that how the market responds to this sell-off will be key in the next session. Initial support at $57.05 from yesterday’s low. The 50% Fibonacci retracement at $59.60 is a key basis of resistance again.
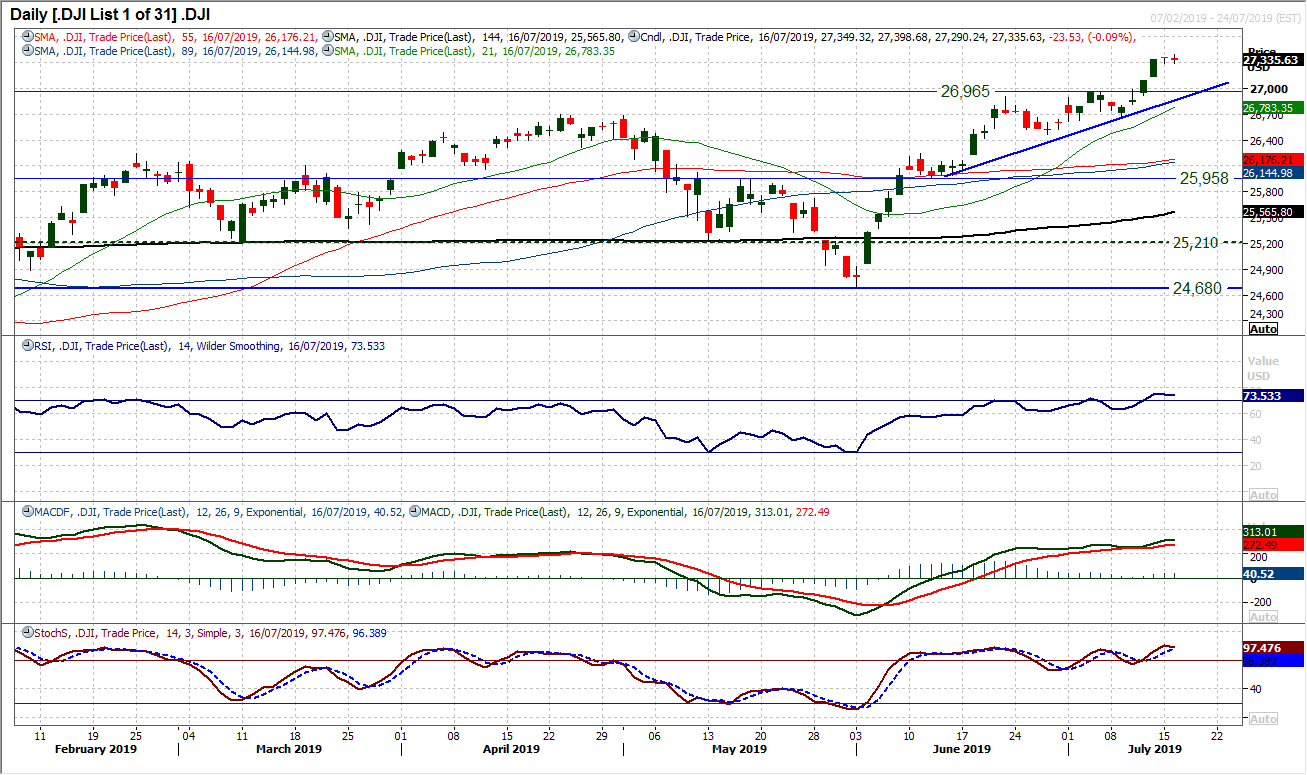
Dow Jones Industrial Average
A second day of consolidation has the bulls just entering into more of a ponderous phase now. A move to another intraday all-time high yesterday (27,399) could not be sustained and the market pulled slightly weaker into the close. There is nothing overtly negative about the sessions this week, but given how stretched the market looks near term (RSI into mid-70s is the highest since September), the risk is increasing for a near term unwind. The prime pullback could be to the latest breakout at 26,965 which is the previous July high, but also around where the four week uptrend is supportive. Momentum is still strong on MACD and Stochastics but again a little stretched/tired. The market would certainly benefit from an unwind to help renew upside potential. The higher reaction low at 26,665 is the first important support that the bulls would not want to lose.
Author

Richard Perry
Independent Analyst


