Fed minutes propel markets

USD: Sept '25 is Down at 97.085.
Energies: Aug '25 Crude is Down at 68.13.
Financials: The Sep '25 30 Year T-Bond is Lower by 2 ticks and trading at 114.00.
Indices: The Jun '25 S&P 500 emini ES contract is 20 ticks Lower and trading at 6302.25.
Gold: The Aug'25 Gold contract is trading Up at 3334.60.
Initial conclusion
This is not a correlated market. The USD is Down and Crude is Down which is not normal, and the 30 Year T-Bond is trading Lower. The Financials should always correlate with the US dollar such that if the dollar is Higher, then the bonds should follow and vice-versa. The S&P is Lower and Crude is trading Down which is not correlated. Gold is trading Higher which is correlated with the US dollar trading Down. I tend to believe that Gold has an inverse relationship with the US Dollar as when the US Dollar is down, Gold tends to rise in value and vice-versa. Think of it as a seesaw, when one is up the other should be down. I point this out to you to make you aware that when we don't have a correlated market, it means something is wrong. As traders you need to be aware of this and proceed with your eyes wide open. Asia traded Mixed. Europe is trading Mixed as well.
Possible challenges to traders
-
Unemployment Claims are out at 8:30 AM EST. This is Major.
-
FOMC Member Musalem Speaks at 9 AM EST. This is Major.
-
Natural Gas Storage is out at 10:30 AM EST. This is Major.
-
30 Year Bond Auction Starts at 1 PM EST. This is Major.
-
FOMC Member Waller Speaks at 1:15 PM EST. This is Major.
-
FOMC Member Daly Speaks at 2:30 PM EST. This is Major.
Traders, please note that we've changed the Bond instrument from the 10 Year (ZN) to the 2 Year (ZT). They work exactly the same.
We've elected to switch gears a bit and show correlation between the 2-year Treasury notes (ZT) and the S&P futures contract. The YM contract is the Dow Jones Industrial Average, and the purpose is to show reverse correlation between the two instruments. Remember it's likened to a seesaw, when up goes up the other should go down and vice versa.
Yesterday the ZT climbed Higher at around 8:30 AM EST with no eco news pending. The Dow dived Lower at the same time. Look at the charts below and you'll see a pattern for both assets. The Dow dived Lower at 8:30 AM EST and the ZT climbed Higher at around the same time. These charts represent the newest version of Bar Charts, and I've changed the timeframe to a 15-minute chart to display better. This represented a Long opportunity on the 2-year note, as a trader you could have netted about a 20 plus ticks per contract on this trade. Each tick is worth $6.25. Please note: the front month for ZT is now Sep '25 and the Dow is now Sep '25. I've changed the format to filled Candlesticks (not hollow) such that it may be more apparent and visible.
Charts courtesy of BarCharts
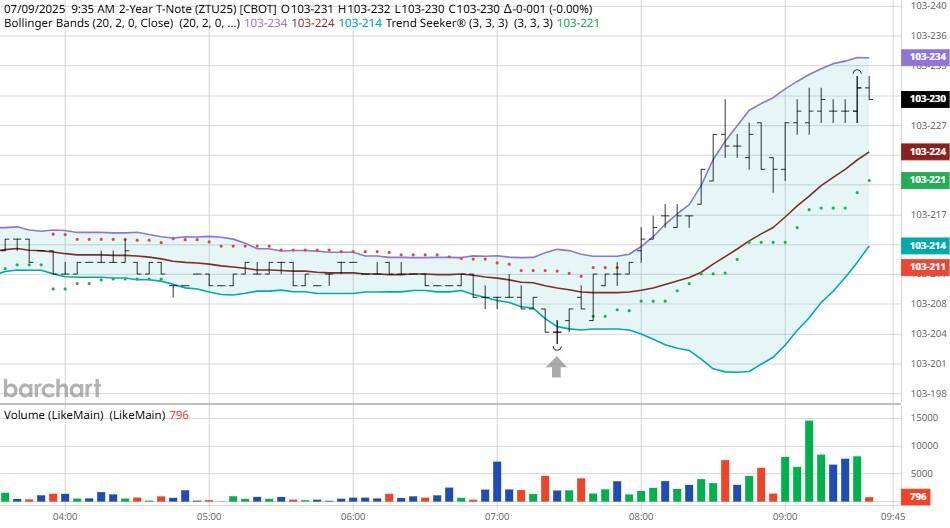
ZT -Sep 25 - 7/09/25
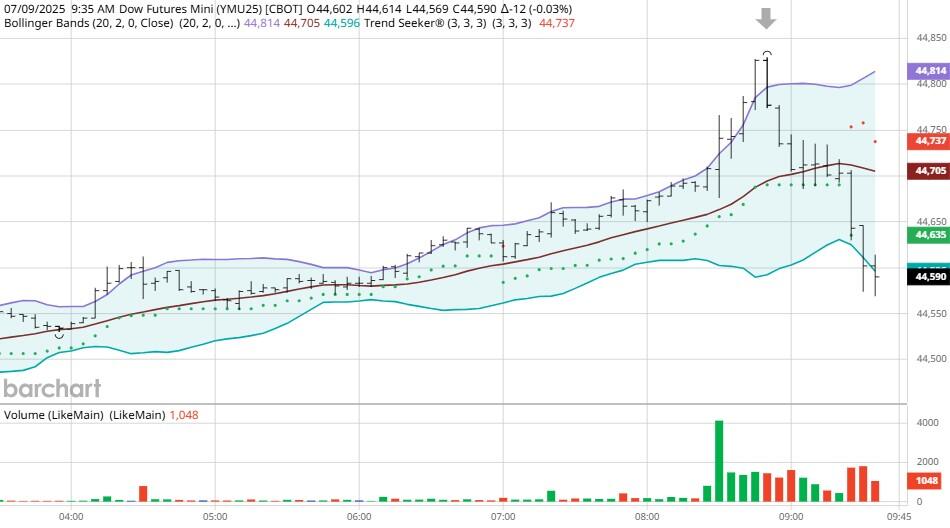
Dow - Sep 2025- 7/09/25
Bias
Yesterday we gave the markets a Neutral or Mixed bias however the markets had other ideas as the Dow closed Higher by 218 points, and the other indices closed Higher as well. Today we aren't dealing with a correlated market, and our bias is Neutral or Mixed.
Could this change? Of Course. Remember anything can happen in a volatile market.
Commentary
Yesterday the FOMC Meeting Minutes revealed that the Federal Reserve is seriously considering lowering interest rates, and this president should realize this instead of using his name calling, bullying method with anyone who disagrees with him. Want to learn Market Correlation and determine market direction hours before the Opening Bell?
Author

Nick Mastrandrea
Market Tea Leaves


