February’s US employment situation report in focus

Due to its timeliness, accuracy and importance within the broader economy, the employment situation report—often referred to as the non-farm payrolls release—is a closely monitored indicator.
As well as a leading indicator of consumer spending, non-farm payrolls represent a measure of new payrolls added by private and government organisations across the United States (US), reported each month by the Bureau of Labour Statistics (BLS).
Two comprehensive reports are used to cover the unemployment rate (the household survey) and the headline non-farm payrolls (the establishment survey). In most cases, the non-farm payrolls release attracts the majority of the attention, often vibrating through financial markets. A positive number reveals additional jobs were added to the economy, while a negative number, displayed as -100k or -90k, means jobs were lost in non-farm business.
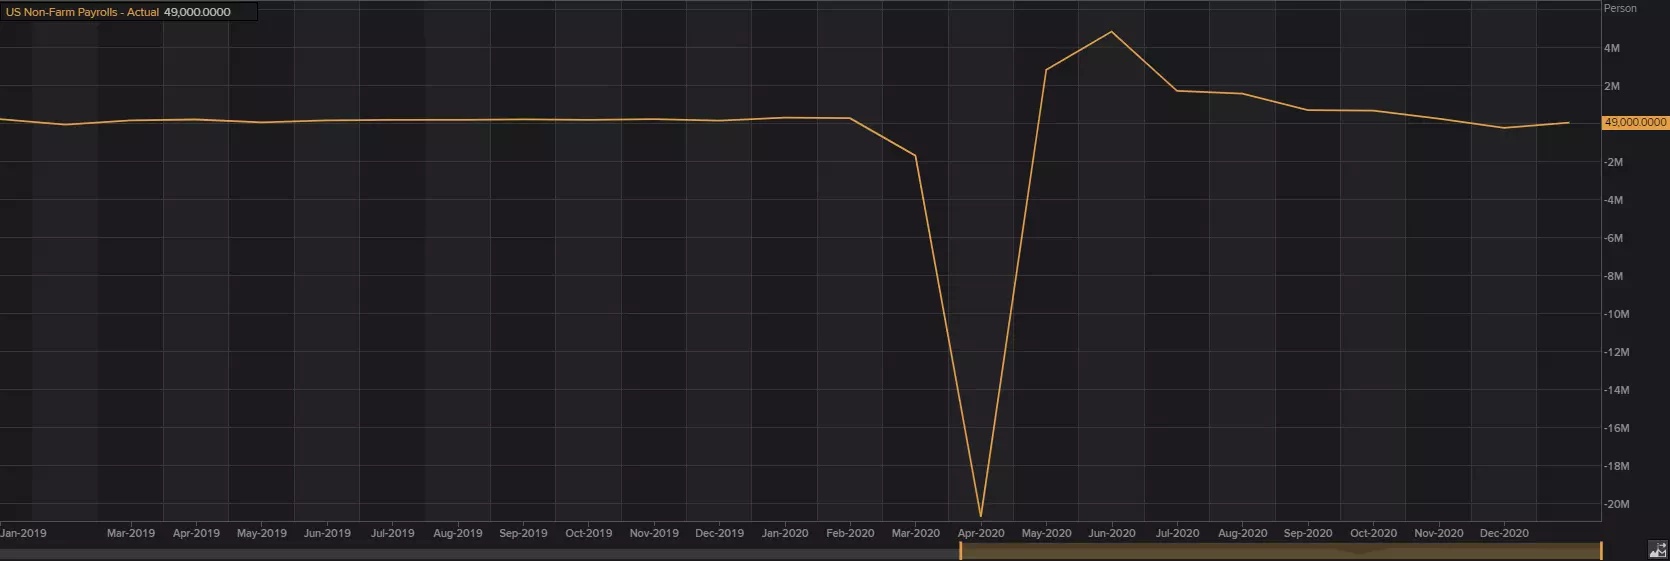
January’s total non-farm payroll employment added 49,000 jobs—a lower-than-forecast print of 85,000, though better than December’s downwardly revised -227,000 reading.
According to the BLS, job gains were noted in professional and business services along with both public and private education. However, this was counterbalanced by declines seen in leisure and hospitality, retail trade, health care, as well as transportation and warehousing.
The general consensus range for February’s US non-farm payrolls is for an increase between 185,000 and 200,000.
(Source: Reuters)
Unemployment rate
The unemployment rate is a closely followed economic indicator, derived from a monthly survey called the Current Population Survey (CPS), made up of approximately 60,000 households.
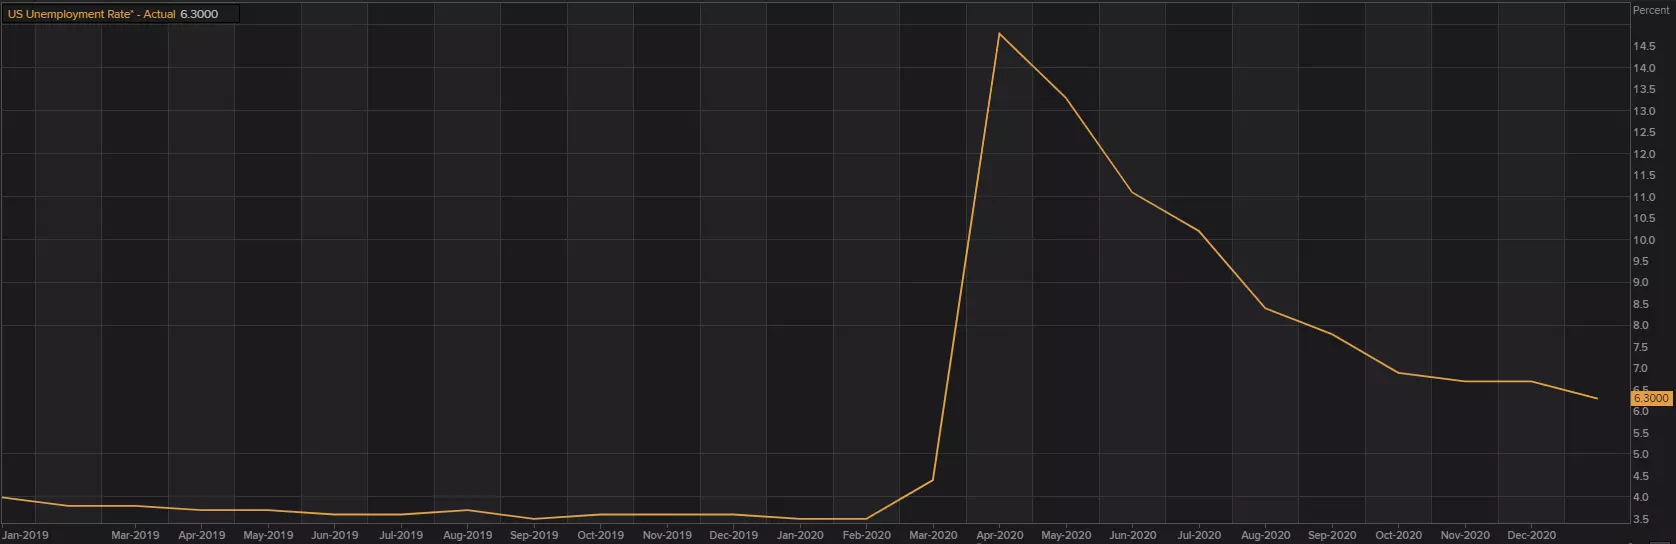
The Household Survey, derived from the BLS report, revealed the unemployment rate dipped 0.4 percentage points to 6.3 percent in January (consensus forecast: 6.7%).
This means the number of unemployed decreased to 10.1 million, but despite the report noting its ninth consecutive decline, following April 2020 highs, the unemployment rate remains well above pre-pandemic levels in February2020 (3.5 percent and 5.7 million, respectively).
The BLS’s Household Survey added that unemployment rates for adult men and women came in at 6.0 percent (previous: 6.4 percent [men] 6.3 percent [women]). Teenagers, between 16 and 20 years old,registered 14.8 percent—lower than December’s 16.0 percent reading.
The survey also noted the following points:
In January, the share of employed persons who teleworked because of the coronavirus pandemic edged down to 23.2 percent. These data refer to employed persons who teleworked or worked at home for pay at some point in the last 4 weeks specifically because of the pandemic.
In January, 14.8 million persons reported that they had been unable to work because their employer closed or lost business due to the pandemic--that is, they did not work at all or worked fewer hours at some point in the last 4 weeks due to the pandemic. This measure is 1.1 million lower than in December.
February’s unemployment reading is forecasted to remain unchanged at 6.3 percent.
(Source: Reuters)
Average hourly earnings
Calculated by the BLS (establishment survey data), average hourly earnings measure the amount employees make each hour in the US. Average hourly earnings for US non-farm employees is a leading indicator of consumer inflation and also the earliest data in terms of labour inflation.
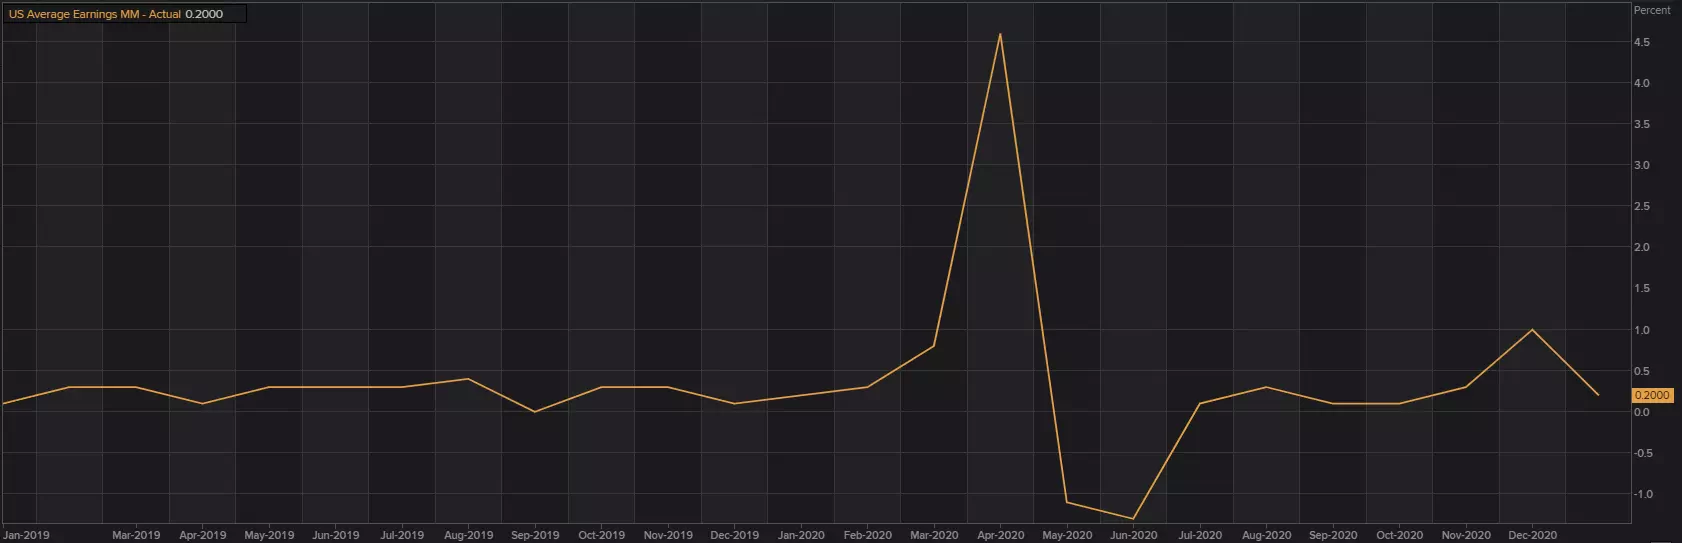
Average hourly earnings increased to $29.96 in January, a rise of 6 cents from December’s $29.90 read.
Average workweeks for non-farm employees increased to 35 hours in January, from December’s 34.7 hour print. Notably, the workweek in manufacturing increase by 0.3 hours to 40.4 hours.
The consensus estimate for February’s average hourly earnings is anticipated to remain unchanged at 0.2 percent.
(Source: Reuters)
ADP Non-farm employment change
Published by the ADP Research Institute, in association with Moody's Analytics, the ADP non-farm employment release estimates the number of employed during the prior month, excluding farming and government. The headline figure is derived from ADP's payroll database, covering one-fifth of US private payroll employment. ADP is considered an early snapshot, a preview, of the upcoming BLS report. The report covers three main categories: the national snapshot (the headline release), small businesses and franchise employment.
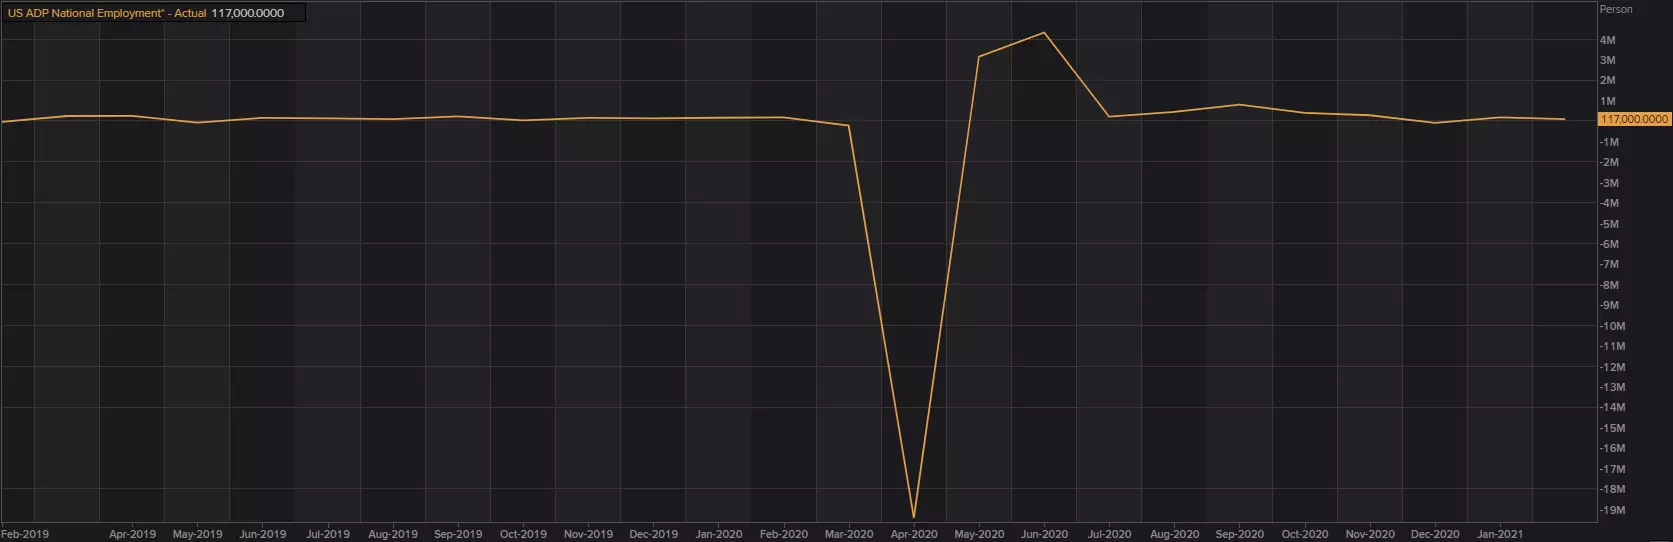
Private sector employment, according to the ADP National Employment Report released on Wednesday, increased by 117,000 in February.
By company size, medium-sized business of 50–499 employees witnessed the largest increase at 57,000. By sector, the service-providing industry added 131,000 jobs, with trade/transportation and utilities adding 48,000 new payrolls.
‘The labour market continues to post a sluggish recovery across the board’, said Nela Richardson, chief economist, ADP. ‘We’re seeing large-sized companies increasingly feeling the effects of COVID-19, while job growth in the goods producing sector pauses. With the pandemic still in the driver’s seat, the service sector remains well below its pre-pandemic levels; however, this sector is one that will likely benefit the most over time with reopenings and increased consumer confidence’.
(Source: Reuters)
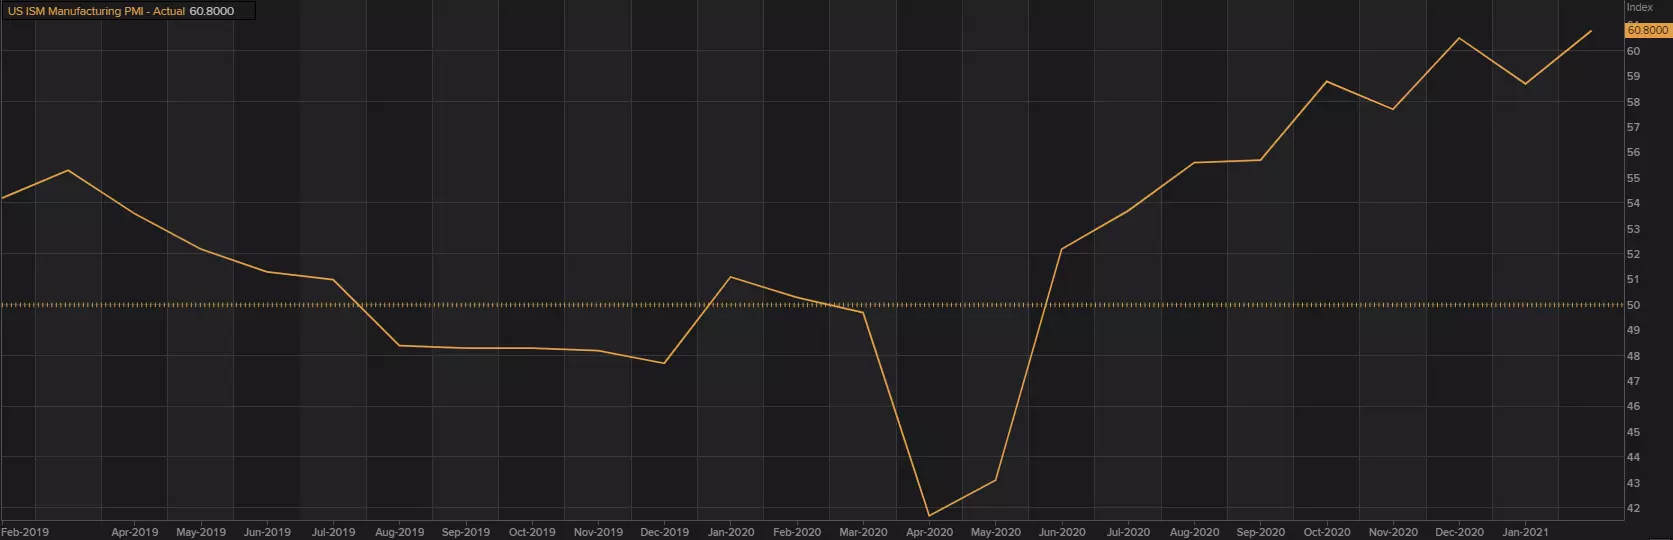
ISM manufacturing PMI
Data are based on surveys of purchasing managers nationwide. Survey respondents are asked if they are experiencing a higher, lower or no change in activity for each of the 10 components, including New Orders and Employment.
The release, which provides timely information on manufacturing,offers investors and traders a window into business activity, in addition to some insight into what the non-farm payrolls release might be.
Headline manufacturing data, according to the Institute of Supply Management (ISM), recorded a nine-month expansion in February, following March, April and May’s contraction. The manufacturing PMI recorded 60.8 percent, increasing by 2.1 percentage points from January’s print of 58.7 percent. A headline number above 50 is consistent with both manufacturing and economic expansion.
‘The Manufacturing PMI continued to indicate strong sector expansion and US economic growth in February. Four of the five subindexes that directly factor into the PMI were in growth territory and at a higher level compared to January’, says Timothy R. Fiore, Chair of the Institute for Supply Management.
(Source: Reuters)
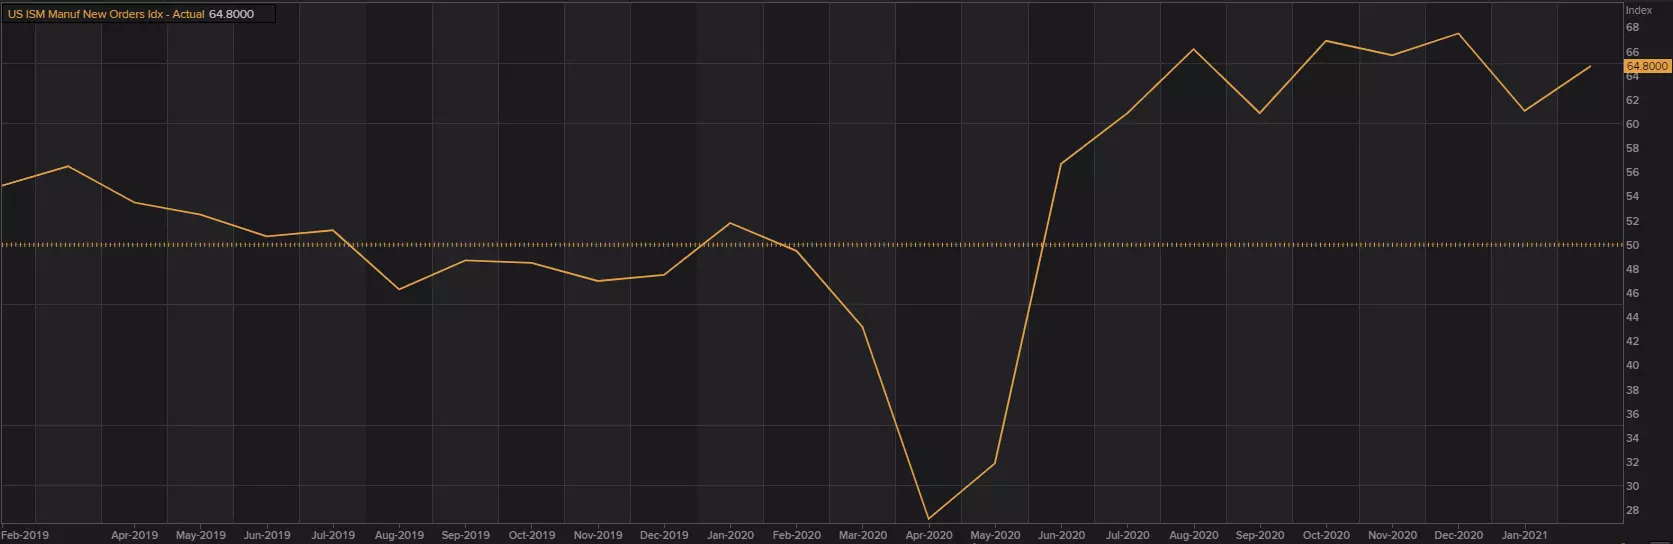
New Orders Index recorded 64.8 percent in February, indicating a ninth consecutive month of growth.
(Source: Reuters)
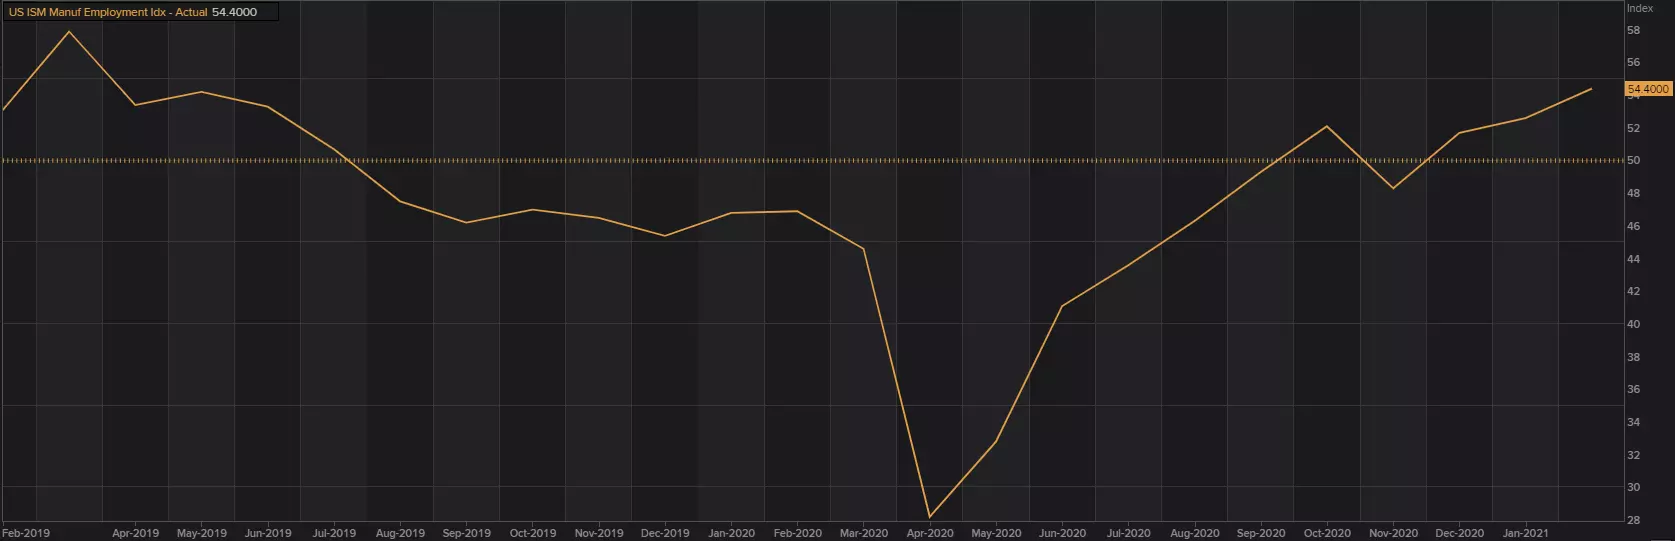
Employment Index registered 54.4 percent in February, increasing for a third consecutive month.
‘For the sixth straight month, survey panellists’ comments indicate that significantly more companies are hiring or attempting to hire than those reducing labour forces’ said Fiore.
ISM also noted:
An Employment Index above 50.6 percent, over time, is generally consistent with an increase in the Bureau of Labour Statistics (BLS) data on manufacturing employment.
Of the 18 manufacturing industries, 11 industries reported employment growth in February.
(Source: Reuters)
Interestingly, all but the Inventories and Customers’ Inventories Indexes remained in expansionary territory in February. Overall, the manufacturing sector continues to grow, pencilling in a ninth consecutive month of growth.
Figures above the 50 percent mark suggests expansion in manufacturing; under 50 percent indicates a contractionary phase.
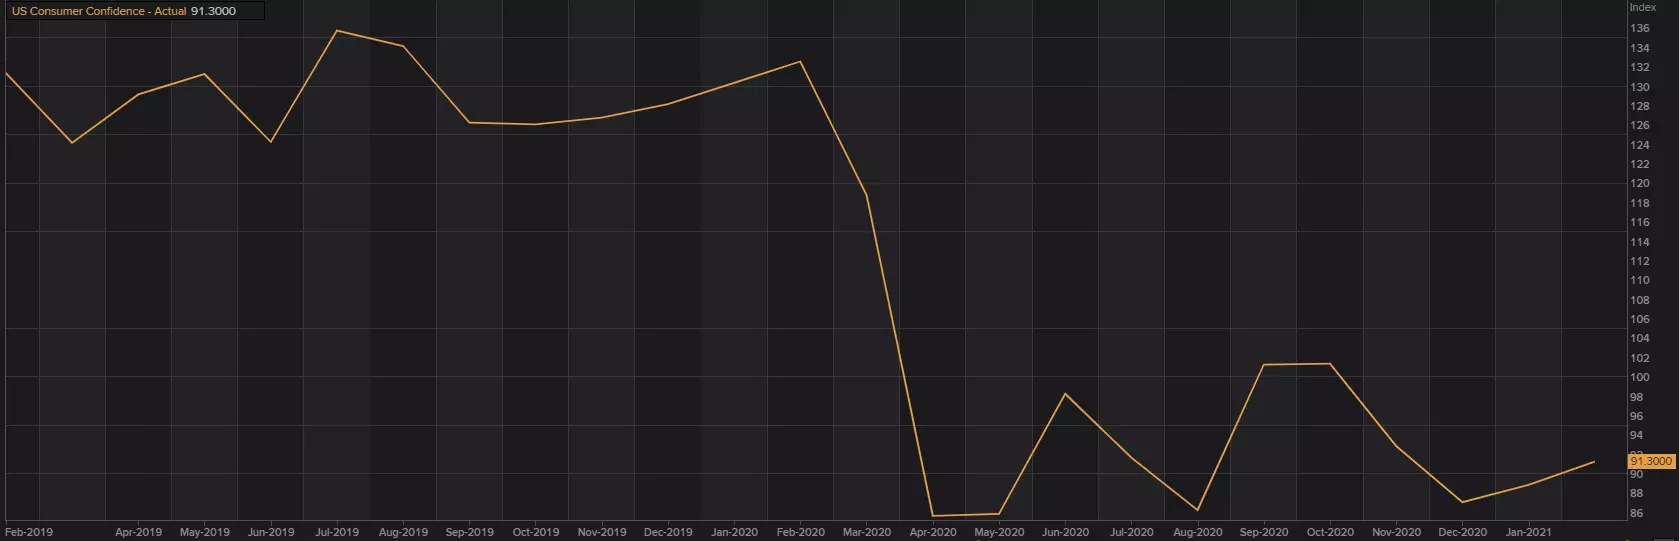
Consumer confidence
Each month the Conference Board surveys a nationwide sample of 5,000 households, consisting of a questionnaire. The report gauges individual (household) confidence levels concerning the performance of the economy.
According to the Conference Board:
February’s consumer confidence registered 91.3, advancing from 88.9 in the month of January (consensus forecast: 90.2).
The Present Situation Index recorded 92.0 in February from an 85.5 reading in January.
The Expectations Index fell to 90.8 in February from January’s 91.2 print.
‘After three months of consecutive declines in the Present Situation Index, consumers’ assessment of current conditions improved in February’, said Lynn Franco, Senior Director of Economic Indicators at The Conference Board. ‘This course reversal suggests economic growth has not slowed further. While the Expectations Index fell marginally in February, consumers remain cautiously optimistic, on the whole, about the outlook for the coming months’.
Overall, we have been forming a consolidation (a potential bottom) around (85.70) since April 2020 (COVID-induced lows).
An uptrend in the index is generally viewed as positive for the economy and can bode well for the upcoming non-farm payrolls release, while a sustained downtrendis typically interpreted as bearish.
(Source: Reuters)
Initial jobless claims
Measured by the Department of Labour, unemployment claimsrepresentthe sum of first-time claims for state unemployment insurance. Because data are released weekly, this is a widely watched indicator.
Initial first-time unemployment claims inched higher last week. The Labour Department, for the week ending February 27, noted the advance figure for seasonally adjusted initial claims was 745,000, an increase of 9,000 from the previous week's 736,000 revised level (consensus: 758,000). As you can see from the chart, initial claims have levelled off since August 2020, with claims capped under the 890,000 mark.
The DOL also noted:
The previous week's level was revised up by 6,000 from 730,000 to 736,000. The 4-week moving average was 790,750, a decrease of 16,750 from the previous week's revised average. The previous week's average was revised down by 250 from 807,750 to 807,500.
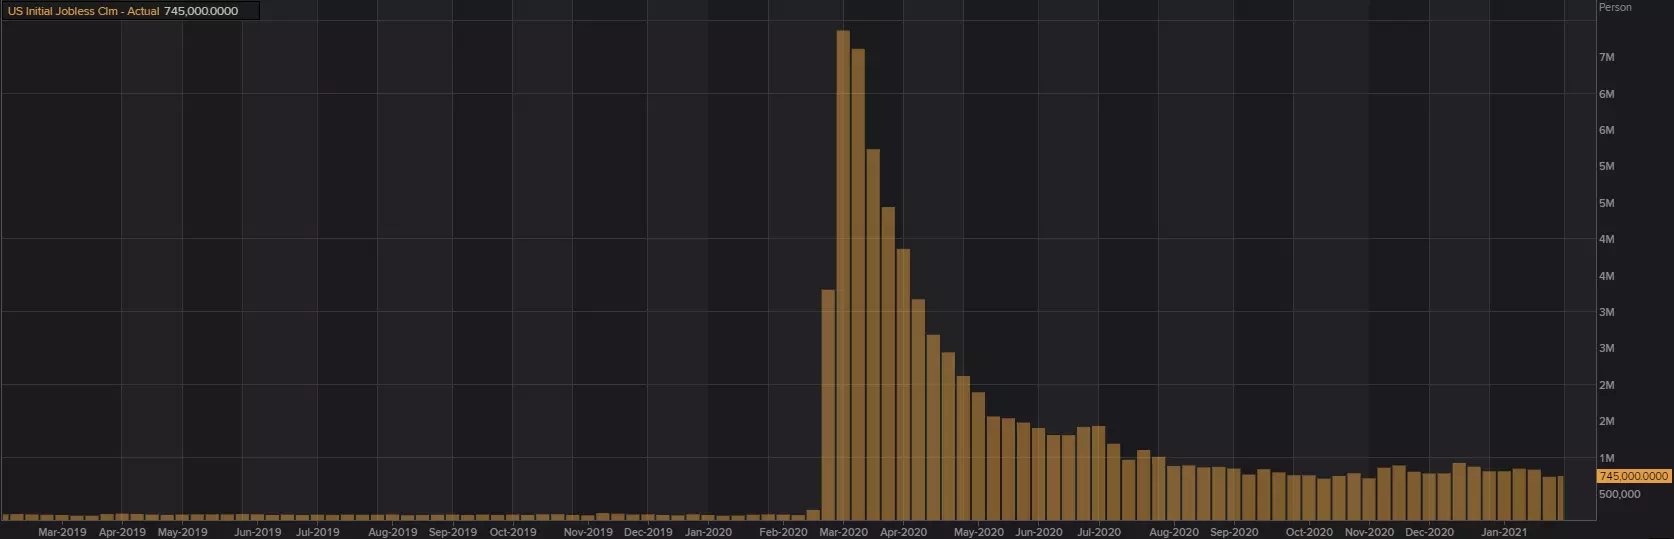
(Source: Reuters)
Continuing claims declined, falling 124,000 to under 4.3 million—a pandemic-low. Continuing claims arethose filing for unemployment benefits again following aninitial claim.
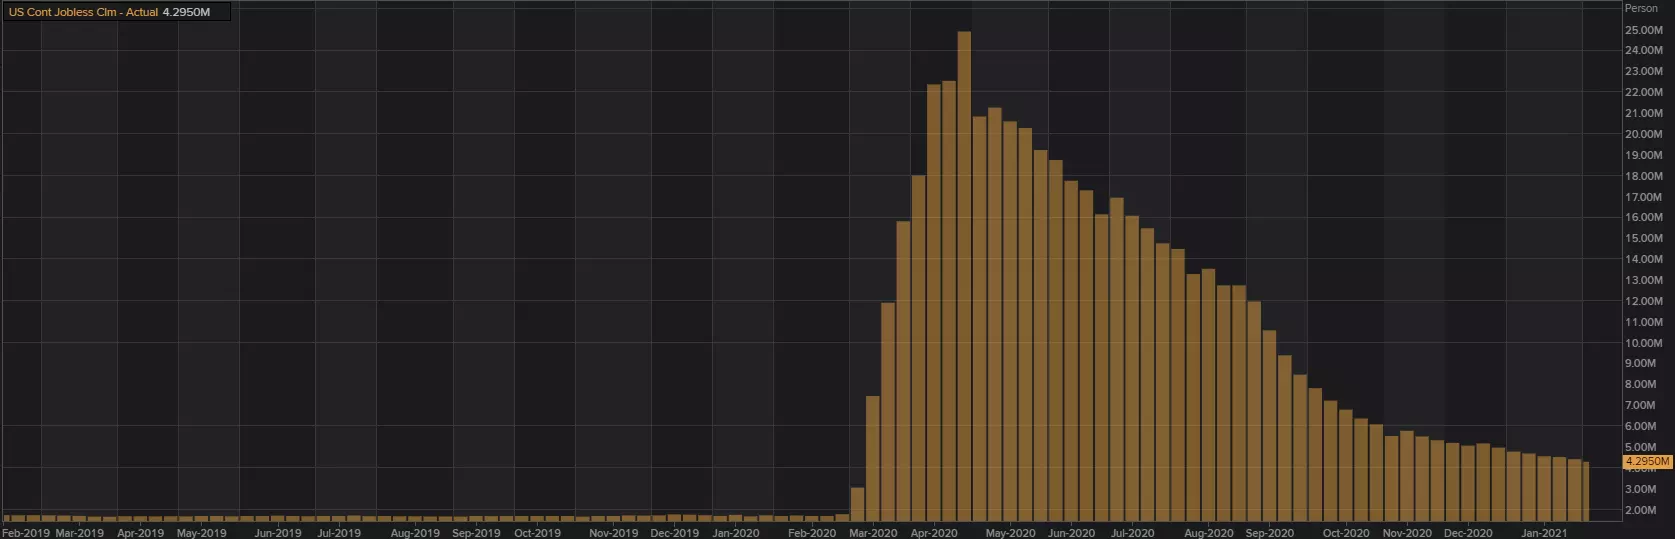
(Source: Reuters)
FP markets technical view
Monthly timeframe:
Despite economic indicators pointing to somewhathealthieremployment, the US dollar’s technical picture, as measured by the US dollar index, remains bearish.
Kicking off from the top, monthly price structure dethroned a long-term trendline support (72.83) in December (2020) and in February retested the underside of the ascending base. To the downside, technicians likely have support at 88.65 on the radar. Further downstream, however, notable support resides around 83.22, joined by a number of Fib levels (Fib cluster).
Depending on the structural view one takes regarding swing points, the broader outlook (black arrows) shows a major downtrend in play. Price topped around the 103.00 level (between 2017 and 2020), following a deep pullback from 2008. Continuation lower, according to the trend, therefore, is potentially on the table over the coming months/years.
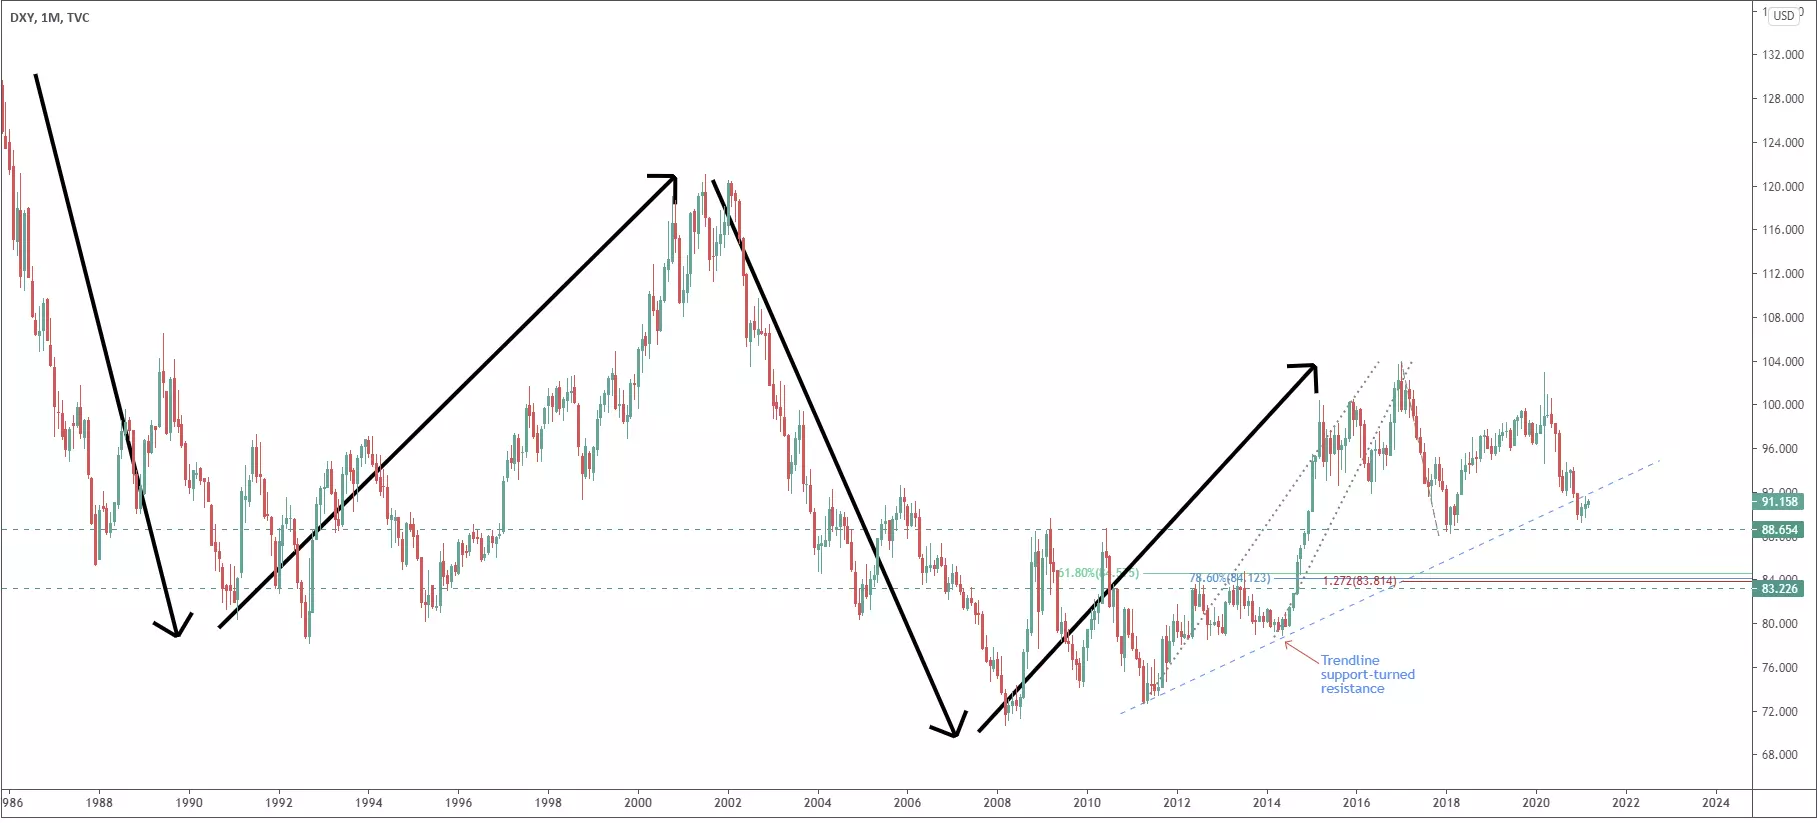
(Source: Trading View—US dollar index monthly chart)
Daily timeframe:
The technical landscape on the daily scale reveals the US dollar has been firm, following the mid-week trough at 90.63.
In conjunction with the monthly timeframe’s trendline support-turned resistance, the daily timeframe is currently shaking hands with an interesting point of resistance drawn from 92.29 and 91.95 (made up of a 127.2% Fib projection at 92.29, a 100% Fib extension at 92.15, a 50.00% retracement at 91.95 and a resistance level fixed at 92.11).
Additional points of note on this timeframeare the trend, launching a series of lower lows and highs since topping in early March 2020, and the 200-day simple moving average hovering just above the 92.29/91.95 resistance zone. In addition, the RSIindicator trades within striking distance of the overbought range.
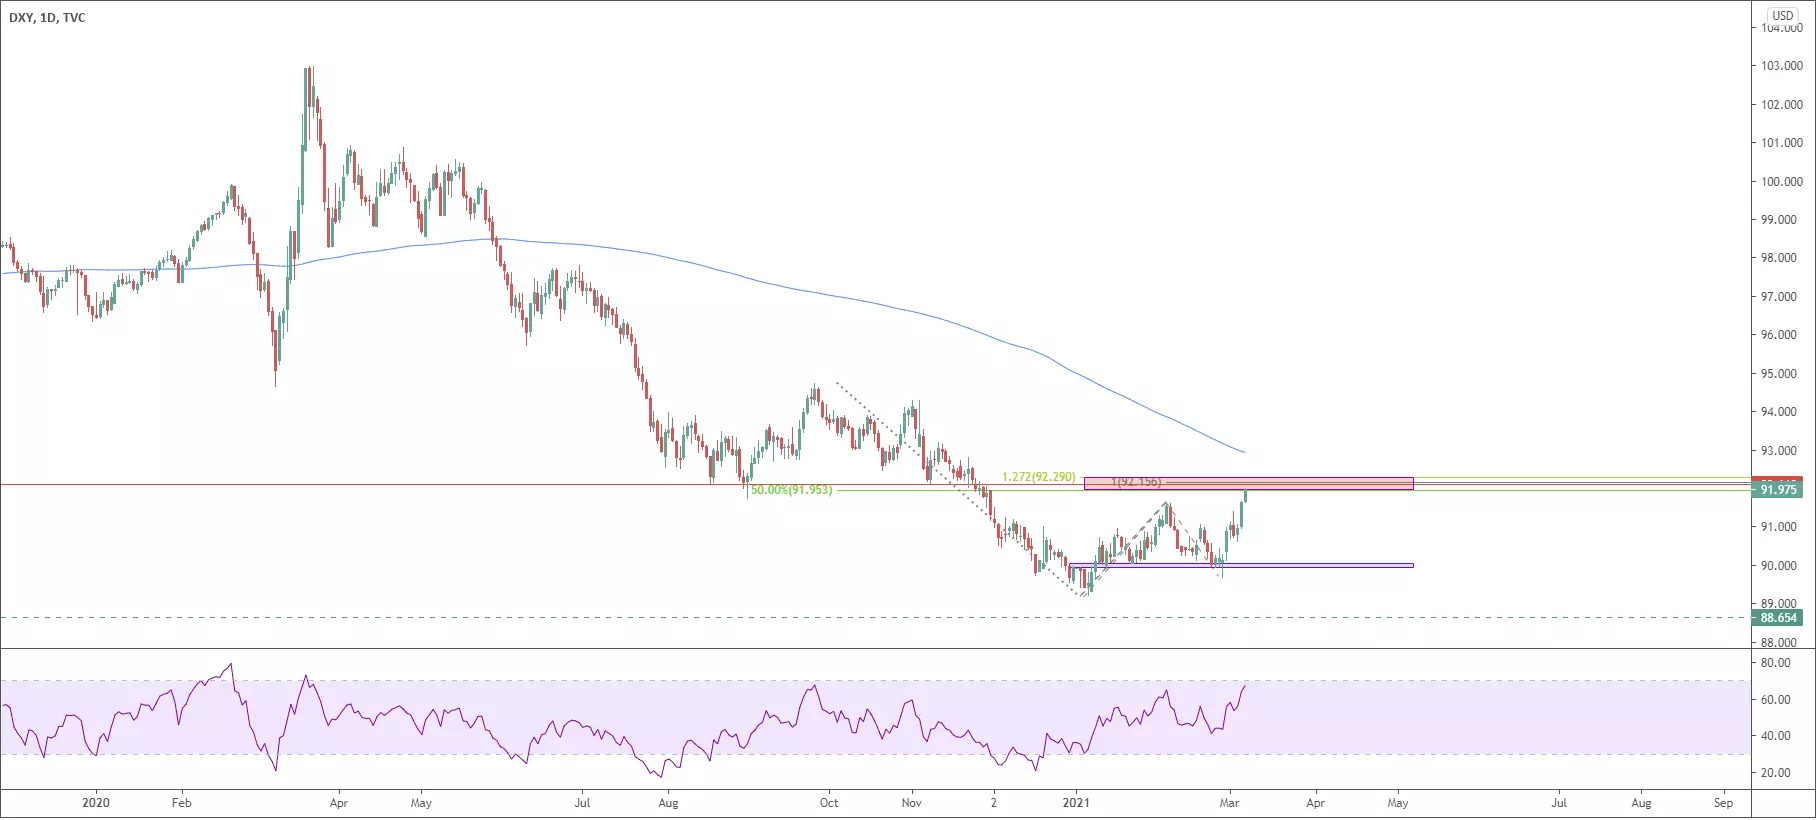
(Source: Trading View—US dollar index daily chart)
Premium
You have reached your limit of 3 free articles for this month.
Start your subscription and get access to all our original articles.
Author

Aaron Hill
FP Markets
After completing his Bachelor’s degree in English and Creative Writing in the UK, and subsequently spending a handful of years teaching English as a foreign language teacher around Asia, Aaron was introduced to financial trading,


