Even More Cracks in the Golden Dam

We’re getting there. Inch by inch, we’re moving closer to the tipping point of the decline when the slow, regular, and somewhat boring move lower turns into a violent drop. Yesterday’s session was still in line with the less exciting manner of declining, but we saw another crack in the dam that’s still somewhat holding the prices at the current levels. It doesn’t seem that it’s going to last for long. Are you prepared?
Before moving to the details of yesterday’s session, we would like to stress that the key bearish factors that we outlined in our Monday’s analysis remain up-to-date, so if you haven’t had the chance to read it yet, we strongly encourage you to do so today. Gold is likely to drop far in the next 2.5 weeks.
Having said that, let’s take a look at yesterday’s price changes.
Miners’ Underperformance Completes the Bearish Case
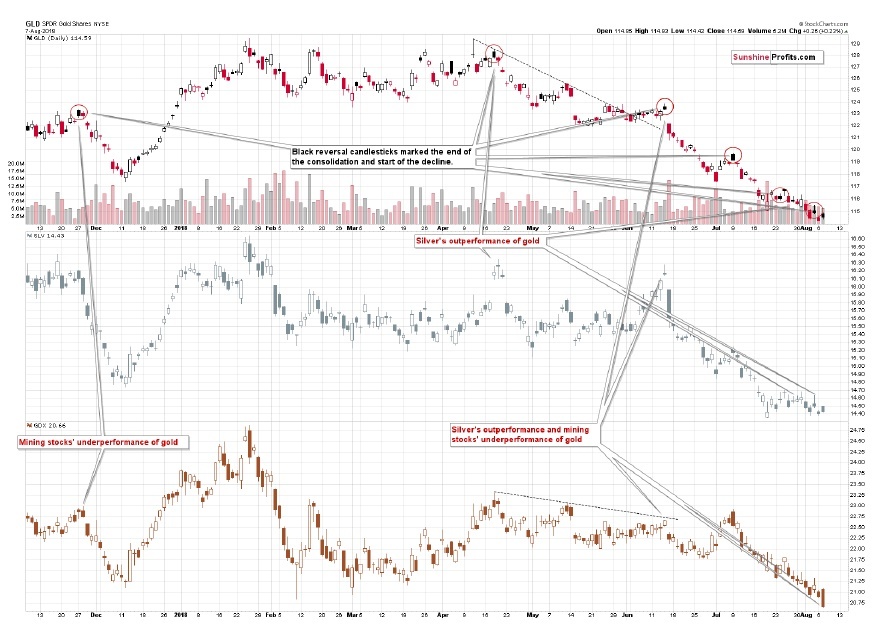
On Monday, we commented on the above chart in the following way:
The GLD ETF ended the session only $0.40 higher and since its opening price was above the closing price, Stockcharts marked this session in black. As we emphasized yesterday, these sessions may – and recently did – indicate the end of the brief upswing and the beginning of another wave down.
The SLV price outperformed on an intraday basis by rallying almost to Tuesday’s (July 31st) intraday high, while the GLD price was not even close to its July 31st high. That’s yet another bearish sign as silver often outperforms in this way just before declines.
We haven’t seen underperformance in mining stocks, but their performance has not been particularly strong either. The GDX ETF didn’t invalidate the breakdown below the previous 2018 and lows and it bouncedrecently did – indicate the end of the brief upswing and the beginning of another wave down. from the 2017 lows in a rather inconclusive manner. Overall, it seems that we haven’t seen any convincing signs from the mining stocks’ Friday price action.
With bearish signs from GLD and SLV and a neutral one from GDX, the overall implications of Friday’s intraday action, are bearish.
Now, based on yesterday’s profound decline in mining stocks, we can say that the relativity-based outlook is completely bearish. We have all the confirmations from the relative valuations that we could get. Silver outperformed on a very short-term basis and mining stocks underperformed in a very clear manner. And if that wasn’t enough, the GLD ETF repeated the bearish black candlestick that heralded declines multiple times in the previous months.
Let’s keep in mind that this is not the first time that we’re seeing this kind of bearish confirmation – we’ve been seeing them over and over again in the past weeks. The implications of this trend in gold, silver and miners are strongly bearish.
Gold Stocks’ Major Breakdown
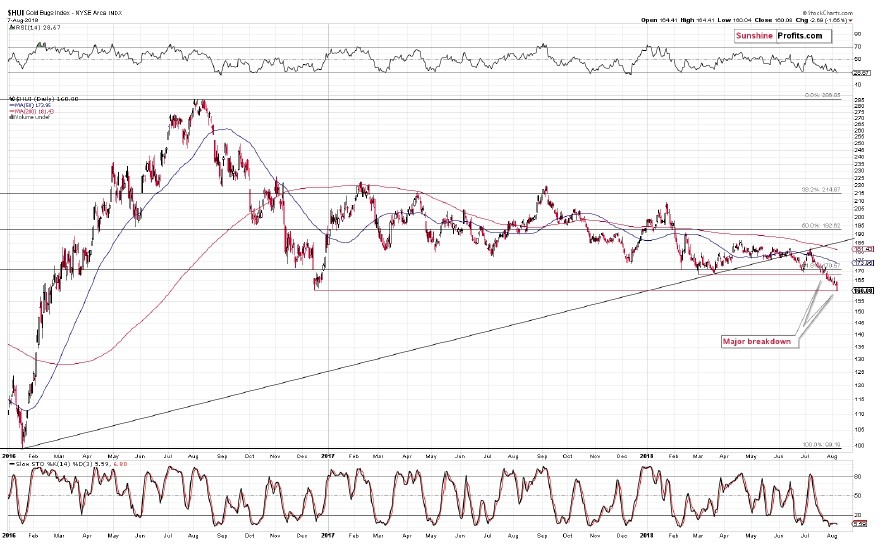
In our yesterday’s Alert, we emphasized that the HUI Index was already after a breakdown below the late 2016 low in terms of the weekly closing prices and it was now once again after a breakdown in terms of daily closing prices. The previous attempt had been invalidated and followed by a small and rather unreliable rally. The fact that we saw another attempt so soon and that it resulted in a lower low suggests that the breakdown may be successful this time.
Yesterday’s big decline serves as a strong indication that the breakdown will indeed be confirmed. Only one additional daily close is required for our 3-day confirmation rule. The fact that HUI closed below the late 2016 low also in intraday terms is a strong indication that the daily-close breakdown will indeed be confirmed.
If the HUI Index had moved just a bit below the late 2016 low as a result of a huge decline in gold, we would say that the breakdown probably was accidental and that it was still likely to be invalidated. But that was not the case. Gold stocks took a dive without barely any help from gold and this tells us that the breakdown is very likely to be confirmed.
The late 2016 low is gold stocks’ last stand. Once they break below this level, there is no significant support all the way down to the early 2016 low. To be precise, there’s also the 2008 bottom at about 150, but if gold truly slides and gold miners continue to underperform, this level may not hold.
The final crack in the precious metals dam that we’ll discuss today is what we saw in silver.
Silver’s Breakdown
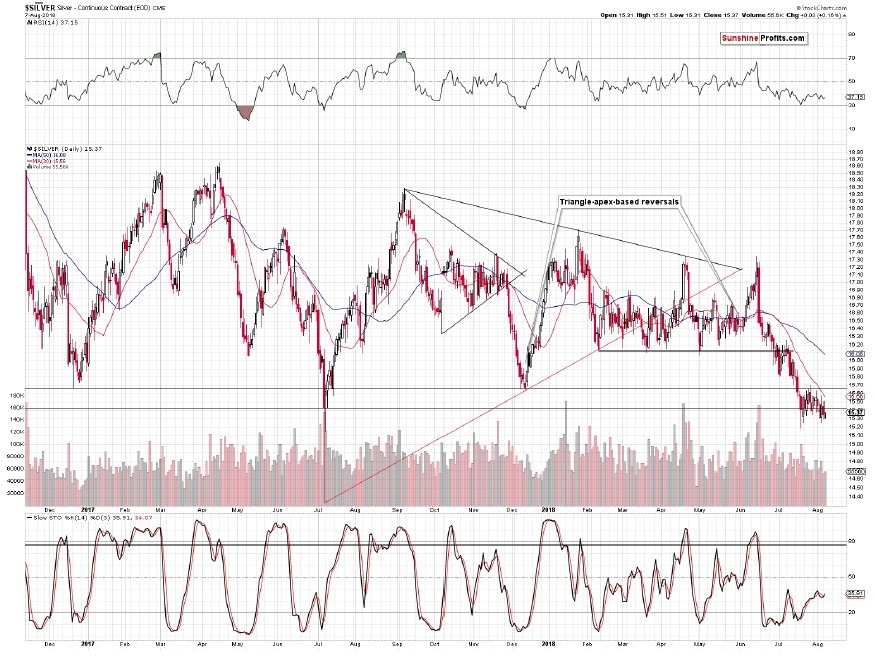
But didn’t silver move higher yesterday?
It did. But only by 3 cents, which means that it was the first time since early 2016 when silver closed below $15.43 (July 2017 bottom) for more than one day. That’s a very important breakdown and it’s almost confirmed by the 3-day rule. The breakdown is not yet fully confirmed, but silver is definitely showing us that something is very different this time than it was in mid-2017 when it rallied sharply shortly after the intraday reversal.
Naturally, the implications are bearish.
There’s not much more that we can report to you today as the situation in other important charts is just as we described it on Monday. The PMs appeared to be on the verge of a major decline and this appears to be even more likely based on what happened yesterday and during Monday’s session.
Want free follow-ups to the above article and details not available to 99%+ investors? Sign up to our free newsletter today!
Author

Przemyslaw Radomski, CFA
Sunshine Profits
Przemyslaw Radomski, CFA (PR) is a precious metals investor and analyst who takes advantage of the emotionality on the markets, and invites you to do the same. His company, Sunshine Profits, publishes analytical software that any


