Even 70% lower closes in recent weeks hasn't budged stock index futures

North Korea tensions haven't broken the Teflon S&P
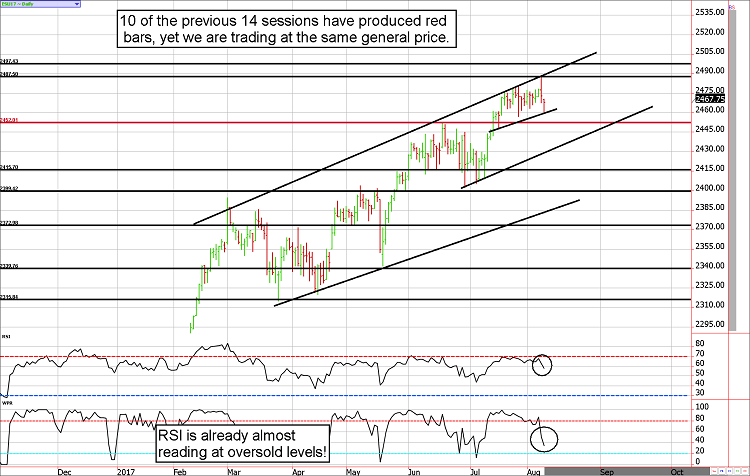
We've noticed that (assuming today closes in negative territory), 10 of the last 14 e-mini S&P 500 sessions have closed in negative territory, yet the index hasn't budged in value. In fact, it is a few handles from where it started the "red" streak. Normally, if the market had such a high rate of negative closes it would be a disaster for the value of the major indices. Is this sideways action the new bear market?
Consumer Confidence is at an all time high while stock market complacency is at an all time high. We have to wonder if this will eventually prove to be a dangerous combination; the world is simply too comfortable.
Market participants are high on the benefits of an easy money policy, but where will the next fix come from? Earnings are good but the market is "richly" priced at current levels. It hasn't paid to be a bear, but the risk of being "long and wrong" is growing rapidly.
Treasury Futures Market
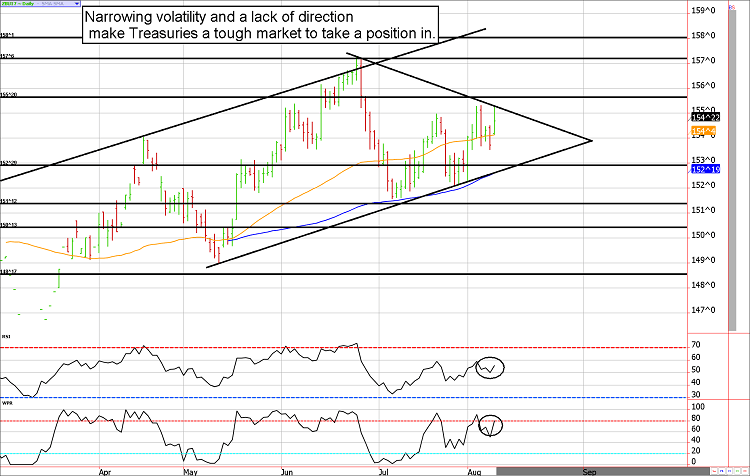
Treasuries are seeing decreasing volatility and a lack of direction. It can't last.
Bonds and notes enjoyed a nice bid in the overnight trade that carried into the day session on increased tensions between the US and North Korea. However, overall the market has been making higher lows and only slightly higher highs. The result is a large wedge pattern forming on the chart.
Breakouts from these types of formations can be explosive and are generally to the upside. If the ZB breaks above 155'11, the market could easily see a run to 158'0. However, if resistance near 155'11 fails a retreat to 153'0 would likely occur. Perhaps such a pullback would be a place for the bulls to consider getting involved.
Treasury Futures Market Analysis
**Bond Futures Market Consensus:** The Treasury market has become quiet, but it won't stay that way. Seasonals are bullish, so large pullbacks probably should be "bought".
**Technical Support:** ZB : 152'29, 151'12, 150'10, and 148'17 ZN: 125'15, 124'24, 124'08, and 123'24
**Technical Resistance:** ZB: 155'11, 157'06, and 158'01 ZN: 126'20, 127'01, and 127'15
Stock Index Futures
The ES ran buy stops on Tuesday, then sell stops on Wednesday...now what?
The historically quiet US stock market has been largely unphased by geopolitical chatter. It is easy for the bulls to get excited about yesterday's rally and the bears to salivate over the subsequent collapse in prices, but in the end, neither can claim a victory. In essence, it was much ado about nothing.
Until the e-mini S&P breaks out of its trading range, there isn't much to say. From a strictly charting perspective, yesterday's test of the trendline resistance near 2487 held and gives the bears a slight edge but that edge will disappear if they can't break the market below 2455 by Friday. If the bears fail to do so, the e-mini S&P would likely drift higher to the 2497 area.
Stock Index Futures Market Ideas
**e-mini S&P Futures Market Consensus:**
Even an uptick in volatility is a non-event in this market. The bears have a slight edge going into tomorrow but they'll need to convert soon to avoid another new high by week's end.
**Technical Support:** 2455, 2436, 2415, and 2399
**Technical Resistance:** 2489, and 2496
e-mini S&P Futures Day Trading Ideas
**These are counter-trend entry ideas, the more distant the level the more reliable but the less likely to get filled**
ES Day Trade Sell Levels: 2478, 2486, and 2497
ES Day Trade Buy Levels: 2455, 2446, and 2436
In other commodity futures and options markets....
May 5 - Buy August e-mini S&P 2000 puts for 5.75 ($287.50).
June 23 - Buy December corn near $3.80 and sell a $380 call option.
June 27 - Establish a covered call in October soymeal (purchase a futures contract near 298 and sell a 300 call.
June 29 - Sell September euro 118 call near 38 ticks.
July 7 - Exit covered call in soymeal to lock in a quick profit. Depending on fills it could have been anywhere from $800 to $980 before transaction costs.
July 19 - Sell the December e-mini S&P futures contract near 2462 and sell a 2460 put against it to provide a healthy upside hedge.
July 27 - Roll $1.18 September euro calls into lopsided strangles using 2 of the September $1.20 calls and 1 September $1.145 put.
July 27 - Exit December corn covered call to lock in a profit of $350 to $400 before transaction costs.
July 28 - Buy December Copper $2.50 puts for about $200.
August 1 - Buy back September Euro 114.5 put to lock in a small profit, then sell double the quantity of the 116 puts to give our short calls a better hedge.
August 2 - Go long December lean hog future and sell at 59 call against it. The result is a risk buffer down to 56 cents, a profit potential of about $1,400 before transaction costs (unlimited risk below 56).
August 3 - Buy back the October ES 2460 put near 40.00 to lock in a moderate gain and sell the November ES 2460 puts near 50.00 to bring in more premium and create a better hedge ahead of the payroll report.
August 3 - Buy back existing Euro strangle and sell fresh September 121 calls and 116.5 puts for a small credit. This should give the market room to move on the payroll report.
August 8 - Roll short Euro 121 calls into 119.50 calls to rebalance the strangle while locking in a gain on the short 121 calls.
August 8 - Exit covered calls in hogs to take a quick profit ($400 to $500 depending on fill prices).
August 9 - Buy December wheat $5.50 calls for about 5 cents.
**There is substantial risk of loss in trading futures and options.** These recommendations are a solicitation for entering into derivatives transactions. All known news and events have already been factored into the price of the underlying derivatives discussed. From time to time persons affiliated with Zaner, or its associated companies, may have positions in recommended and other derivatives. Past performance is not indicative of future results. The information and data in this report were obtained from sources considered reliable. Their accuracy or completeness is not guaranteed. Any decision to purchase or sell as a result of the opinions expressed in this report will be the full responsibility of the person authorizing such transaction. Seasonal tendencies are a composite of some of the more consistent commodity futures seasonals that have occurred over the past 15 or more years. There are usually underlying, fundamental circumstances that occur annually that tend to cause the futures markets to react in a similar directional manner during a certain calendar year. While seasonal trends may potentially impact supply and demand in certain commodities, seasonal aspects of supply and demand have been factored into futures & options market pricing. Even if a seasonal tendency occurs in the future, it may not result in a profitable transaction as fees and the timing of the entry and liquidation may impact on the results. No representation is being made that any account has in the past, or will in the future, achieve profits using these recommendations. No representation is being made that price patterns will recur in the future.
Author

Carley Garner
DeCarley Trading
Carley Garner is an experienced commodity broker with DeCarley Trading, a division of Zaner, in Las Vegas, Nevada. She is also the author of multiple books including, “Higher Probability Commodity Trading” and “A Trader's First Book on Commodities”.


