EURUSD: Selling rallies is preferred for the medium term trade

EURUSD: 1.2288
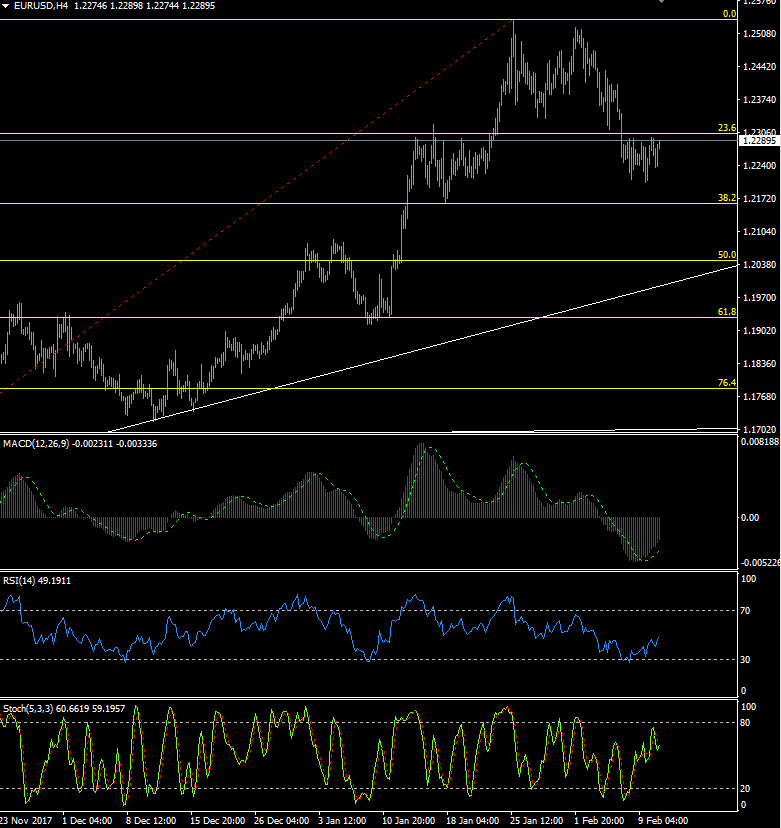
EurUsd has been choppy on Monday and the action lay elsewhere – in the stock markets -, with the pair closing not too far from where it spent much of the session, after a range of 1.2235/1.2896, leaving the overall outlook unchanged.
1 hour/4 hour indicators: Mixed. Turning higher?
Daily Indicators: Turning lower
Weekly Indicators: Turning higher?
Preferred Strategy: With the daily momentum indicators generally pointing lower, further losses still seem possible in the days ahead and a break of 1.2235, and then of the 9 Feb trend low of 1.2205, would hint at a move towards 1.2160, which should be decent support if we see it. Below there, there is little to hold the Euro up until 1.2090/1.2100.
In the meantime, the short term momentum indicators look mildly positive, and on the topside resistance will be seen at 1.2295/1.2300 and at 1.2330. Beyond their looks doubtful today given the lack of economic drivers, but if wrong, look for a run towards 1.2370 which, if seen, would be a decent sell area I think.
Selling rallies is preferred for the medium term trade, with 1.2330 looking toppish today. In the absence of any EU/US data it may end up being another tight session.
Sell EurUsd @ 1.2330. SL @ 1.2380, TP @ 1.2210
| Resistance | Support | ||
| 1.2408 | (61.8% of 1.2537/1.2204) | 1.2235 | Session low |
| 1.2370 | (50% of 1.2537/1.2204) | 1.2235 | 9 Feb low |
| 1.2330 | (38.2% of 1.2537/1.2204) | 1.2180 | Minor |
| 1.2296 | Session high | 1.2160 | (38.2% of 1.1553/1.2538) |
| 1.2283/86 | (23.6% of 1.2537/1.2204) | 1.2135 | Minor |
Economic data highlights will include:
NFIB Business Optimism Index, API weekly Crude Oil Stock Inventory
W: German CPI/HICP, German/EU GDP, Industrial Production, US Retail Sales, CPI, Business Inventories, EIA weekly crude oil stock change
T: EU Trade Balance, New York State Empire Mfg Index, US PPI, Philadelphia Fed Mfg Survey, Jobless Claims, Capacity Utilisation,
F: German Wage Price Index, US Housing Starts, Building Permits, Import/Export Index
Author

Jim Langlands
FX Charts
Jim Langlands began his trading career in the commodities markets in London in 1976, before moving to Australia in 1979 to work as a floor trader on the Sydney Futures Exchange.


