EURUSD: Mildly Bullish – Prefer to sell rallies

EURUSD: 1.1668
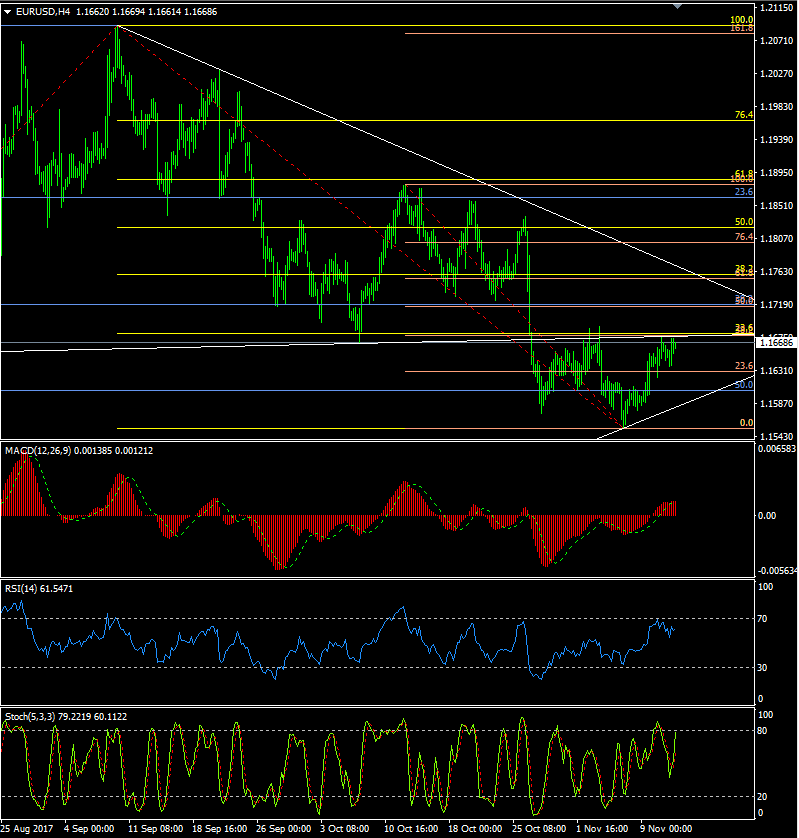
Preferred Strategy: EurUsd had a steady session on Monday although the Euro remains underpinned into the close, sitting just below the neckline of the head/shoulders formation having tested it by reaching a high of 1.1675.
As before, while I prefer t be short, some caution is warranted as the momentum indicators, including the dailies, seems to be turning to point higher although as long as the Euro holds below 1.1675 on a daily-close basis, shorts can be maintained; but with a tight SL above there. A topside break of 1.1675 would trigger stops and could see a run back to 1.1700 where the 100 DMA will provide stern resistance, but above there could see a bigger squeeze towards the descending trend resistance at around 1.1775.
On the downside, support will today be seen at the session low (1.1635), at 1.1620 and again at around 1.1580/85, where the rising trend support also lies. Below there, the trend low at 1.1553 and the Fibo level at 1.1510 will come into play although probably not today.
Right now the upside looks to be the path of least resistance, but I would still look to sell into strength, with a SL placed tight above the 100 DMA. The weeklies still point lower but any tax-bill headlines should be watched closely this week, as any hint of a delay would have quite an impact on markets, possibly sending the dollar sharply lower. The US Retail Sales and CPI on Wednesday are the next key event risks. Keep SL tight on any short positions but look to sell into strength above 1.1700, with a SL again placed quite tight, above the 100 DMA at around 1.1735 or above the Descending trend resistance, currently at 1.1760.
Watch out for any central bankers headlines from the ECB conference today alongside a busy calendar.
Sell EurUsd @ 1.1710. SL @ 1.1740, TP @ 1.1500.
| 24 Hour: Mildly Bullish – Prefer to sell rallies | Medium Term: Mildly Bearish – Prefer to sell rallies | ||
| FX Charts Position: | Short – Looking to add to the position into strength | ||
| Resistance | Support | ||
| 1.1760 | (61.8% of 1.1879/1.1574) | 1.1635 | Session low |
| 1.1715/18 | (50% of 1.1879/1.1574)/100 DMA | 1.1620 | 200 HMA /10 Nov low |
| 1.1686/90 | 3 Nov high /(38.2% of 1.1879/1.1574) | 1.1578 | Rising trend support |
| 1.1675/77 | H.S. Neckline /Session high/10 Nov high | 1.1553 | 7 Nov low |
| 1.1660 | 200 WMA | 1.1510 | (38.2% of 1.0570/1.2091) |
Economic data highlights will include:
German CPI/HICP, Preliminary Q3 GDP, EU Preliminary GDP, Industrial Production, German/EU ZEW Economic Sentiment Survey , US PPI, US NFIB Business Optimism Index, API Weekly Crude Oil Stock Inventory, Speeches” Draghi, Yellen, Carney, Kuroda
Author

Jim Langlands
FX Charts
Jim Langlands began his trading career in the commodities markets in London in 1976, before moving to Australia in 1979 to work as a floor trader on the Sydney Futures Exchange.


