Eurozone: The headache of slow disinflation

The preliminary inflation numbers for February had the effect of a cold shower due to the acceleration of core inflation. To assess the observed price developments since the start of last year, monthly inflation has been calculated for more than 400 HICP components. The frequency distribution for average monthly inflation between October 2022 and January 2023 has hardly shifted compared to that for the first quarter of 2022 but the nature of inflation has shifted. Annual energy price inflation has dropped but food price inflation continues to accelerate. As the different shocks reverberate, inflation becomes sticky. Going forward, wage developments should also play a key role. The latest inflation data have caused a jump in the expected terminal rate, which implies a bigger headwind to activity. When inflation surprises to the upside, the likelihood that growth ends up surprising to the downside increases.
The preliminary inflation numbers for February had the effect of a cold shower. Admittedly, headline inflation eased to 8.5% from 8.6% in January but this was higher than the consensus expectation of 8.2%.
The real issue however was core inflation, which accelerated to 5.6% (5.3% in January). Is there a better way to illustrate the challenge of the ECB than the 0.8% print of monthly inflation excluding energy, food, alcohol and tobacco? Yet, certain survey data provide some elements of hope, although the overall picture remains very mixed.
The latest European Commission’s survey shows that the downward trend of selling price expectations in manufacturing industry continued in February. In retail trade they edged down in February, thereby continuing a moderate downward trend that started in November. In construction, price expectations continued their decline. However, in services, selling price expectations have been fluctuating in a narrow range for several months, without any clear trend and consumers’ price expectations for the next 12 months have stabilized in February after declining significantly since autumn last year. S&P Global’s purchasing managers’ indices for February showed a “rate of increase in selling price expectations staying sharp and well above it’s long-run average” and in services, output price inflation was among the strongest on record1.
To assess the observed price developments since the start of last year, monthly inflation has been calculated for the more than 400 HICP components2. The frequency distribution for average monthly inflation between October 2022 and January 2023 has hardly shifted compared to that for the first quarter of last year (chart 1)3. Compared to the third quarter, it has even shifted slightly to the right (chart 2).
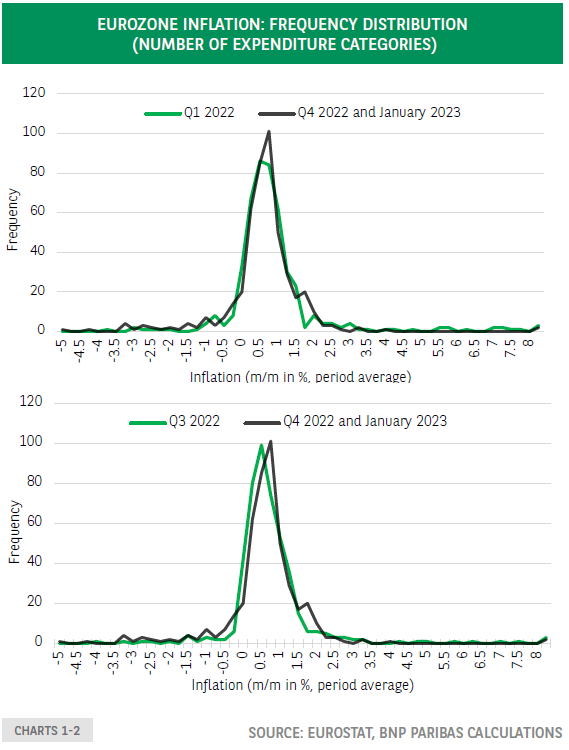
Chart 3 uses the same data to trace the dynamics of individual components. In some cases, high monthly inflation in the first quarter of last year has been followed by low monthly inflation more recently -this has been the case for petrol, gas, electricity- but in other cases -many food items-, the opposite has happened. This illustrates the shifting nature of inflation.
Author

BNP Paribas Team
BNP Paribas
BNP Paribas Economic Research Department is a worldwide function, part of Corporate and Investment Banking, at the service of both the Bank and its customers.


