-
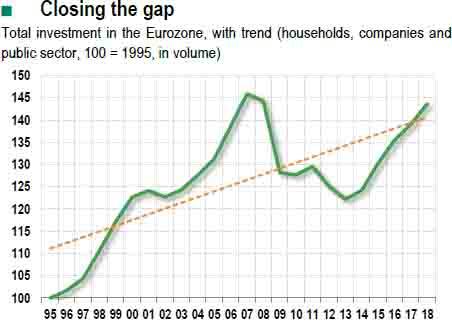
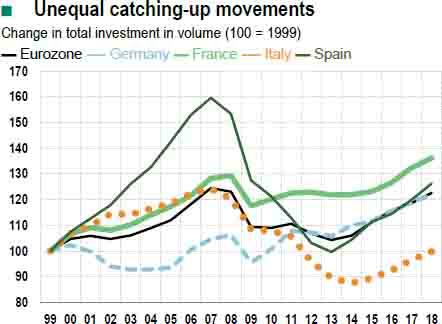
From 2008 to 2013, the eurozone experienced a sharp decline in investment. Despite a belated turnaround in 2014, total investment is still holding below its pre-crisis level.
-
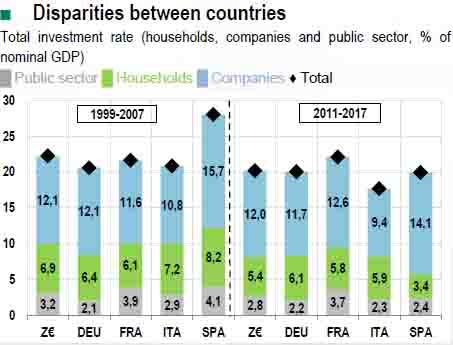
There are wide disparities between countries. After the crisis, the investment rate dropped off sharply in Spain, for example, but rose in France.
-
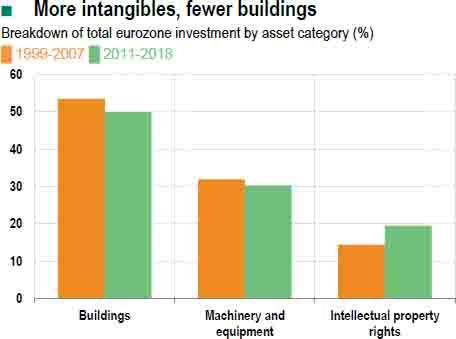
The share of investment allocated to intangible assets, notably research and development, has increased to the detriment of tangible assets.
A protracted period of declining investment
In the eurozone, the back-to-back financial and sovereign debt crises of 2008 and 2012 had a prolonged impact on investment (see chart 1). Several factors hampered investment decisions, notably the increase in the cost of financing, especially in the countries hit hardest by the 2011- 12 crisis, and more generally, the difficult access to credit at a time of major financial fragmentation1. Another major factor was the high level of uncertainty, which placed a significant and ongoing strain on investment. After 2009, the difficult turnaround in fixed gross capital formation (FGCF) also occurred at a time when the eurozone's already high level of public debt continued to rise, and aggregate demand remained weak3, notably in some of the southern European countries.
A belated but notable turnaround
In the post-crisis period (2011-2017), the average investment rate for the eurozone was about 2 points of GDP lower than in the pre-crisis period (1999-2007). This decline can be seen in most of the major economies, with the exception of France, where the investment rate increased slightly to an average of 22% of GDP in the post-crisis period5 (see chart 2). Although the investment rate did not decline much in Germany, it fell much more sharply in Italy (-3.2 points to 17.7% of GDP) and especially in Spain (-8 points to about 20%). This suggests a correction following the emergence of major surplus capacity before the crisis, notably in the construction sector.
In the eurozone, the average growth in volume of investment (see chart 3) was cut in half between the two periods (from an annual average of 3.2% in 1999-2007 to 1.5% in 2011-2018). The slight decline in Germany's investment rate masks a sharp acceleration in the volume of GFCF. After a period of sluggish growth before the crisis (averaging about 1%), the total volume of investment rose 2.5% in Germany in the postcrisis period. All in all, Germany made a strong contribution to the investment dynamics of the eurozone as a whole during this period.
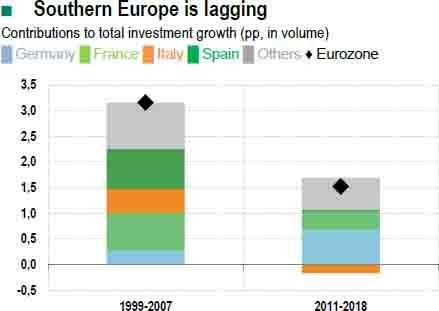
In Spain, where investment had reached levels that were hardly sustainable, the 2008 crisis triggered a sharp correction that brought investment in 2013 to the 1999 level. Since then, there has been a strong and sustained rebound in investment. Italy's investment profile is unique. After declining for seven consecutive years (2008-2014), the volume of investment returned to positive growth in 2015, but by 2018, it had only barely returned to the 1999 level (see chart 4).
Greater investment in intangible assets
The decline in the eurozone's overall investment rate was accompanied by a slight shift in its composition between the pre-crisis and post-crisis periods. Intangible assets7 as a share of total GFCF increased to about 20% to the detriment of tangible assets, including buildings and "machinery and equipment" (see chart 5). The growing importance of intangibles as a share of investment can be seen in the four major eurozone economies. Yet the share is still relatively small in Spain (averaging 14.5% of the total in the post-crisis period) and Italy (15.7%), compared to France (23.4%) and to a lesser extent Germany (18.1%). Inversely, "machinery and equipment" as a share of GFCF was not as high in France as in the other three major economies, reflecting in part the relative weakness of industrial value added (excluding construction) as a share of total value added (14% in 2018 in France vs. 26% in Germany and a little less than 20% in Italy and Spain).
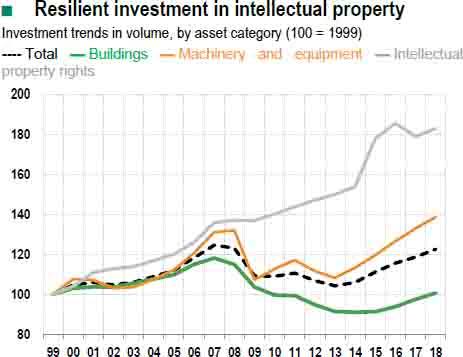
Investment profiles in volume confirm the dynamic pace of investment in "intellectual property rights"8 (see chart 6). Investment spending on "machinery and equipment" was hard hit by the crisis, and notably by the world trade shock of 2009. Inversely, investment spending on "intellectual property rights" does not seem to have been hit as hard: it remained virtually flat in 2007-2009 before picking up again as of 2010. This resilience can be seen not only in Germany and France (bolstered by the research tax credit reforms9) but also in Spain.
R&D effort must still be confirmed
Among the market sectors in the major eurozone economies, investment rates are especially high for industry (excluding construction) and "information and communication services", suggesting a high level of capital intensity.
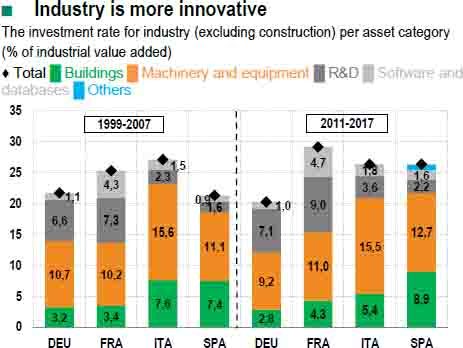
In industry, the average investment rate increased in the postcrisis period in France and Spain, whereas it declined slightly in Germany and Italy (see chart 7). Yet industry's investment rate in intangible assets increased across the board10, especially for "research and development" (R&D). In this segment, the investment rate remained relatively low in Spain (2.2% of industrial value added) and Italy (3.6%) compared to Germany (7.1%) and especially France (9%). This latter observation must be kept in perspective, however, given industry's relatively weak position in France's productive fabric. In information and communications services, where productivity is relatively high and dynamic, the investment rate also increased for intangible assets in the major eurozone economies, following the same trend as industry. Moreover, it reached a relatively high level compared to other market services. This dynamic pace could partially reflect an intensely competitive environment, which encourages companies to move upmarket, and in general, tends to exclude the weakest companies from the market.
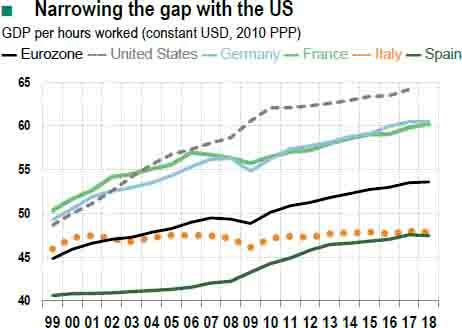
Although eurozone investment has been slowing on the whole, it has tended to shift increasingly towards intangible assets, notably in industry and certain productive services. Investment in R&D will have beneficial effects on the dynamics of productivity in both the short and long term. R&D efforts will have to be maintained and supported. All other factors being the same, although the level of productivity in the eurozone countries is relatively high, in terms of GDP per hour worked, the eurozone has fallen behind the United States since the crisis (see chart 8). There is thus room to close the gap.
BNP Paribas is regulated by the FSA for the conduct of its designated investment business in the UK and is a member of the London Stock Exchange. The information and opinions contained in this report have been obtained from public sources believed to be reliable, but no representation or warranty, express or implied, is made that such information is accurate or complete and it should not be relied upon as such. This report does not constitute a prospectus or other offering document or an offer or solicitation to buy any securities or other investment. Information and opinions contained in the report are published for the assistance of recipients, but are not to be relied upon as authoritative or taken in substitution for the exercise of judgement by any recipient, they are subject to change without notice and not intended to provide the sole basis of any evaluation of the instruments discussed herein. Any reference to past performance should not be taken as an indication of future performance. No BNP Paribas Group Company accepts any liability whatsoever for any direct or consequential loss arising from any use of material contained in this report. All estimates and opinions included in this report constitute our judgements as of the date of this report. BNP Paribas and their affiliates ("collectively "BNP Paribas") may make a market in, or may, as principal or agent, buy or sell securities of the issuers mentioned in this report or derivatives thereon. BNP Paribas may have a financial interest in the issuers mentioned in this report, including a long or short position in their securities, and or options, futures or other derivative instruments based thereon. BNP Paribas, including its officers and employees may serve or have served as an officer, director or in an advisory capacity for any issuer mentioned in this report. BNP Paribas may, from time to time, solicit, perform or have performed investment banking, underwriting or other services (including acting as adviser, manager, underwriter or lender) within the last 12 months for any issuer referred to in this report. BNP Paribas, may to the extent permitted by law, have acted upon or used the information contained herein, or the research or analysis on which it was based, before its publication. BNP Paribas may receive or intend to seek compensation for investment banking services in the next three months from an issuer mentioned in this report. Any issuer mentioned in this report may have been provided with sections of this report prior to its publication in order to verify its factual accuracy. This report was produced by a BNP Paribas Group Company. This report is for the use of intended recipients and may not be reproduced (in whole or in part) or delivered or transmitted to any other person without the prior written consent of BNP Paribas. By accepting this document you agree to be bound by the foregoing limitations. Analyst Certification Each analyst responsible for the preparation of this report certifies that (i) all views expressed in this report accurately reflect the analyst's personal views about any and all of the issuers and securities named in this report, and (ii) no part of the analyst's compensation was, is, or will be, directly or indirectly, related to the specific recommendations or views expressed herein. United States: This report is being distributed to US persons by BNP Paribas Securities Corp., or by a subsidiary or affiliate of BNP Paribas that is not registered as a US broker-dealer, to US major institutional investors only. BNP Paribas Securities Corp., a subsidiary of BNP Paribas, is a broker-dealer registered with the Securities and Exchange Commission and is a member of the National Association of Securities Dealers, Inc. BNP Paribas Securities Corp. accepts responsibility for the content of a report prepared by another non-US affiliate only when distributed to US persons by BNP Paribas Securities Corp. United Kingdom: This report has been approved for publication in the United Kingdom by BNP Paribas London Branch, a branch of BNP Paribas whose head office is in Paris, France. BNP Paribas London Branch is regulated by the Financial Services Authority ("FSA") for the conduct of its designated investment business in the United Kingdom and is a member of the London Stock Exchange. This report is prepared for professional investors and is not intended for Private Customers in the United Kingdom as defined in FSA rules and should not be passed on to any such persons. Japan: This report is being distributed to Japanese based firms by BNP Paribas Securities (Japan) Limited, Tokyo Branch, or by a subsidiary or affiliate of BNP Paribas not registered as a financial instruments firm in Japan, to certain financial institutions permitted by regulation. BNP Paribas Securities (Japan) Limited, Tokyo Branch, a subsidiary of BNP Paribas, is a financial instruments firm registered according to the Financial Instruments and Exchange Law of Japan and a member of the Japan Securities Dealers Association. BNP Paribas Securities (Japan) Limited, Tokyo Branch accepts responsibility for the content of a report prepared by another non-Japan affiliate only when distributed to Japanese based firms by BNP Paribas Securities (Japan) Limited, Tokyo Branch. Hong Kong: This report is being distributed in Hong Kong by BNP Paribas Hong Kong Branch, a branch of BNP Paribas whose head office is in Paris, France. BNP Paribas Hong Kong Branch is regulated as a Licensed Bank by the Hong Kong Monetary Authority and is deemed as a Registered Institution by the Securities and Futures Commission for the conduct of Advising on Securities [Regulated Activity Type 4] under the Securities and Futures Ordinance Transitional Arrangements. Singapore: This report is being distributed in Singapore by BNP Paribas Singapore Branch, a branch of BNP Paribas whose head office is in Paris, France. BNP Paribas Singapore is a licensed bank regulated by the Monetary Authority of Singapore is exempted from holding the required licenses to conduct regulated activities and provide financial advisory services under the Securities and Futures Act and the Financial Advisors Act. © BNP Paribas (2011). All rights reserved.
Recommended Content
Editors’ Picks
EUR/USD stays near 1.0800 after upbeat US data
EUR/USD stays under modest bearish pressure and trades near 1.0800 in the American session on Thursday. The data from the US showed that the real GDP growth for the fourth quarter got revised higher to 3.4% from 3.2%, supporting the USD and weighing on the pair.
GBP/USD stays in daily range above 1.2600
GBP/USD fluctuates in a narrow channel above 1.2600 on Thursday. The better-than-expected Initial Jobless Claims data from the US and the upward revision to the Q4 GDP growth helps the USD stay resilient against its rivals and limits the pair's upside.
Gold pulls away from daily highs, holds above $2,200
Gold retreats from daily highs but holds comfortably above $2,200 in the American session on Thursday. The benchmark 10-year US Treasury bond yield stays above 4.2% after upbeat US data and makes it difficult for XAU/USD to preserve its bullish momentum.
XRP price falls to $0.60 support as Ripple ruling doesn’t help Coinbase lawsuit against SEC
XRP programmatic sales ruling by Judge Torres was completely rejected by another US Court that ruled in favor of the SEC in a lawsuit against Coinbase.
Portfolio rebalancing and reflation trades emerge into Q2
Yesterday’s price action pointed at a possible end-of-quarter portfolio rebalancing as the session saw the laggards of the quarter like Apple and Tesla gain, and the stars like Microsoft and Nvidia retreat.