Europe accelerates Its break from Russian Gas: Between policy and reality
From dependence to deterrence
Europe is once again rewriting its energy map, not out of panic, but out of strategy.
After years of emergency buying and short-term fixes, the European Union is formalising a long-term divorce from Russian gas.
The European Parliament’s energy committee has endorsed a ban on Russian gas imports from January 2026, with limited exemptions for legacy contracts until 2027.
A broader proposal from EU ministers targets a full phase-out by January 2028, marking the bloc’s first coordinated attempt to replace geopolitical exposure with structural autonomy.
The symbolism is clear: Europe wants to prove that energy security can coexist with moral consistency.
But beneath the politics lies a simple question, can a continent that still consumes more than 330 billion cubic metres (bcm) of gas a year truly afford to shut out one of its historical suppliers?
A success built on fragility
Since 2022, the EU has slashed pipeline imports from Russia by nearly 85 %, from 150 bcm to barely 25 bcm.
Storage levels are full, blackouts avoided, and benchmark prices - once above 300 € per MWh - now trade near 32 €.
On paper, the transition looks almost surgical.
But Europe’s new balance rests on a complex web of LNG cargoes, rerouted flows, and political luck.
The continent now depends on the United States and Qatar for almost half of its imported gas, while Norway remains its top pipeline supplier.
That diversification has a price: higher volatility, longer supply chains, and exposure to global spot markets rather than bilateral contracts.
Europe’s independence has come at the cost of stability.
The next shock may not come from Russia, it may come from climate, competition, or capacity constraints.
Ambition meets physics
The 2028 deadline assumes a perfect convergence of policy and infrastructure.
By 2026, the EU’s regasification capacity should reach 280 bcm per year, but that figure remains theoretical.
Bottlenecks persist in the Balkans and Central Europe, where pipeline grids still trace the old Soviet routes.
Even in Western Europe, regional asymmetry means some countries have floating terminals idling while others still rely on gas transits through Ukraine.
Loopholes complicate the political narrative.
The current draft restricts direct Russian imports but doesn’t explicitly prohibit re-exported LNG of Russian origin.
Analysts estimate at least 10 bcm per year still reach European ports under neutral flags.
The molecule, it seems, continues to find a way.
The new economics of gas
Gas prices have normalised from crisis peaks, but not from historical averages.
TTF contracts hover around 33–35 € per MWh, roughly double pre-pandemic levels.
Industrial demand remains 15–20 % below 2019 benchmarks, reflecting a permanent loss of competitiveness.
Energy-intensive industries in Germany, Poland, and Italy operate at reduced capacity, while households face structurally higher bills.
The European Central Bank now treats energy as a persistent inflation vector, complicating monetary policy just as fiscal buffers thin out.
In short, Europe is winning its independence but paying for it monthly.
Russia’s adaptation
For Moscow, the loss of the European market was painful but survivable.
Exports have been redirected toward China, India, and Turkey, and LNG production has climbed to 45 million tonnes annually.
The planned Power of Siberia 2 pipeline, expected by 2029, could deliver 50 bcm a year to China roughly a third of what Russia once sent to Europe.
Still, the pivot comes with diminishing returns.
Discounted pricing, often 30–35 % below European benchmarks, and settlement in non-convertible currencies cut deep into export margins.
Russia remains an energy power, but no longer an energy superpower.
Renko tells the gas story
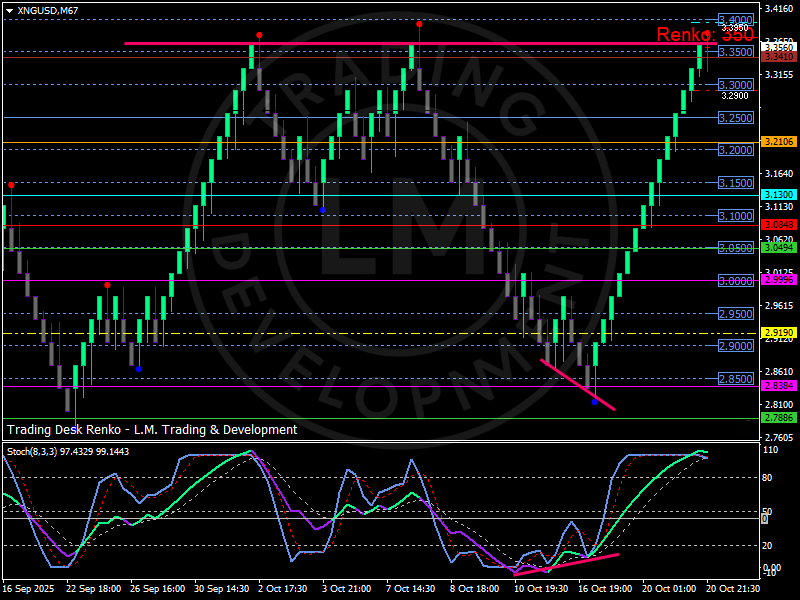
On the Renko Natural Gas (XNGUSD) chart, the rebound is decisive.
After carving a higher-low base near 2,850 $, price surged through 3,000 $, then 3,250 $, and is now testing the 3,3600 $ zone — the same resistance last seen in late September.
Each successive white brick underscores renewed momentum driven by policy headlines and storage optimism.
Support now lies around 3,2100 $, followed by a secondary cushion near 3,100 $.
If prices hold above 3,3500 $, the next technical target stands near 3,4000 $, where previous rallies stalled before seasonal unwinds.
A failure to consolidate here could trigger a quick retracement toward 3,1500 $, the mid-range of the October advance.
Momentum indicators remain stretched, the stochastic oscillator hovers near 99, signalling overbought conditions but not yet divergence.
The structure suggests trend persistence with exhaustion risk, typical of transition phases where headlines amplify sentiment faster than fundamentals.
Technically, gas is no longer trading on fear; it’s trading on narrative, the confidence that Europe can execute its break cleanly.
Macro spillovers
-
FX correlation: a stable gas curve has reduced volatility in the euro; the currency now reacts more to U.S. rate differentials than to TTF spikes.
- Inflation pulse: every 10 € swing in gas adds roughly 0,2 pp to euro-area CPI, keeping policymakers cautious.
- ·Emerging suppliers: Algeria and Azerbaijan capture rising shares of the EU market, reshaping Mediterranean energy diplomacy.
The geopolitical mosaic is shifting from confrontation to competition.
Russia no longer dictates Europe’s energy rhythm, but Europe has yet to find its own time.
Outlook: Winter without fear
Storage levels sit above 96 %, offering a comfortable cushion ahead of winter.
If weather patterns remain mild and Asian demand subdued, prices could stabilise near 3,200–3,300 $ into year-end.
However, any disruption, from U.S. LNG maintenance to an unexpected cold spell, could ignite a sharp short-covering rally toward 3,450–3,500 $.
Three scenarios frame the months ahead:
1. Controlled transition: policy credibility holds, volatility compresses, gas trades quietly in a narrow band.
2. Weather shock: early freeze lifts prices back toward April highs, testing consumer tolerance.
3. Demand fatigue: industrial contraction deepens, pushing prices below 3,000 $, threatening new deflationary pressure.
Each path reinforces the same truth, the decoupling is political, but the consequences are purely economic.
Personal take: From crisis to choreography
Europe’s gas story has moved from emergency to orchestration.
What began as an act of survival has become a choreography of adaptation, producers, traders, and policymakers moving in imperfect sync.
The new rhythm of the market isn’t about panic or policy decrees; it’s about coordination in uncertainty.
Natural gas may have lost its old strategic weight, but it has gained a new role:
as the quiet metronome of Europe’s economic resilience.
Author

Luca Mattei
LM Trading & Development
Luca Mattei is a market analyst focusing on FX, metals, and macroeconomic trends. He develops trading tools for retail and professional traders, coding indicators and EAs for MT4/MT5 and strategies in Pine Script for TradingView.


