EURNZD denies the sell signal from the H&S pattern

Week ago we were writing about the EURNZD, where the price created a nice head and shoulder pattern. Before that, the pair broke the mid-term up trendline (red), so we had strong grounds to be bearish here, especially that the neckline of the H&S pattern mentioned above was breached too. On 11.01 we wrote that:
“As you can see, the technical analysis favours bears and promotes the scenario, where the price should test the 38,2% Fibonacci soon. That makes it a decent mid-term trading opportunity with a potential for 280 pips movement. Sell signal will be denied, once the price will come back above the 23,6% which for now is less likely to happen.”
Back in that time, we were around the 1.6622 and straight after our analysis, the price declined 100 pips more, so indeed, that was a decent mid-term trading opportunity. Unfortunately that was it. We did not make the 280 drop anticipated by us and the price reversed sharply. What is more, we came back above the 23,6%, which as mentioned, denied the sell signal on this instrument.
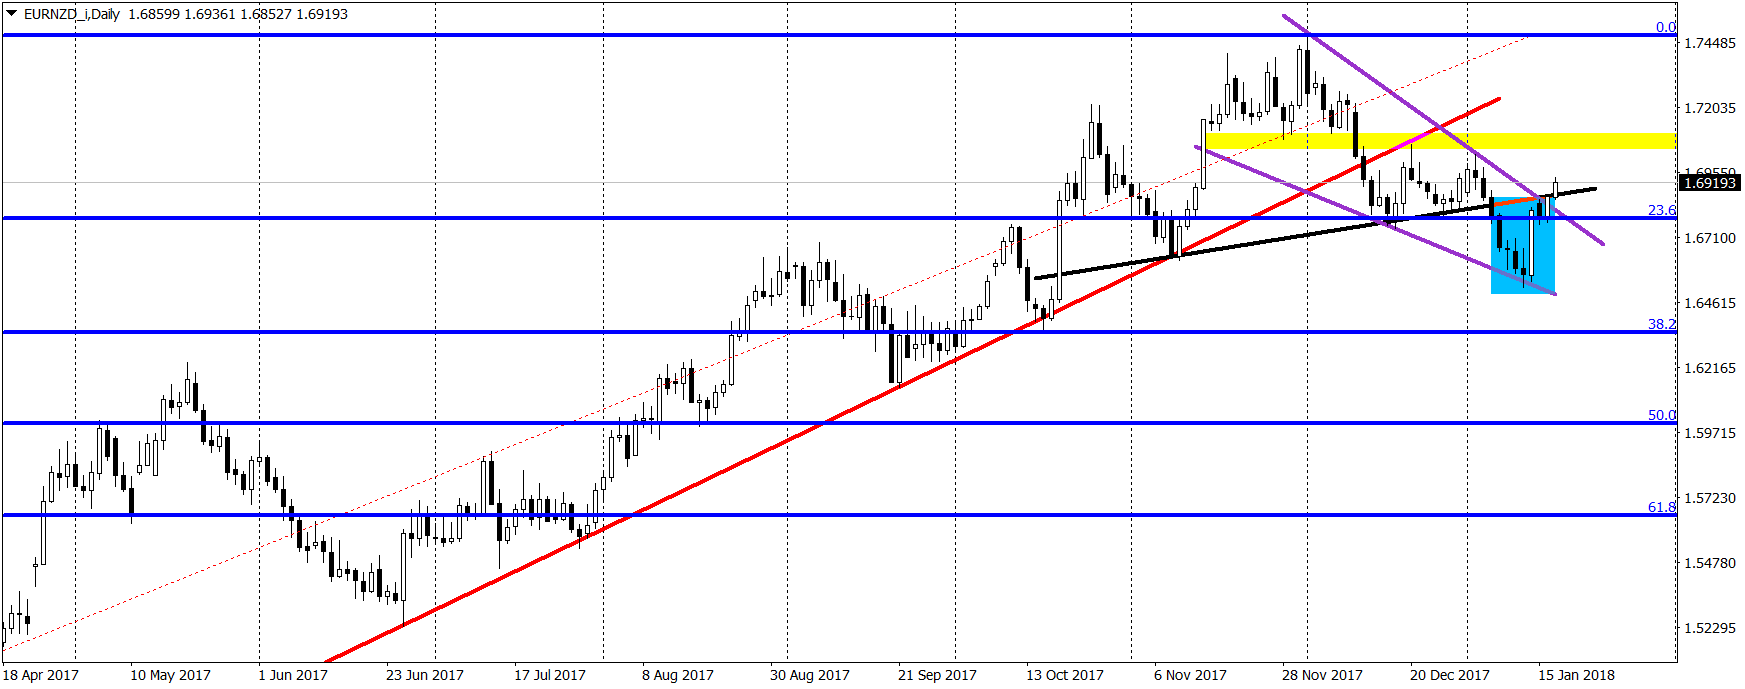
What is the situation now? We can say that all that drop that happened after the neckline was broken, was the false breakout (blue). That is actually a great occasion to open the opposite position,so to go long. We are now back above the neckline and the 23,6% Fibonacci. In addition to that, recent downswing can be locked inside of the wedge pattern (bullish trend continuation pattern), where the upper line of it was already broken (purple). That strengthens the buy signal here. Sentiment is positive as long as we hold above the 23,6%.
Follow us on Twitter @wisniewskifx and @AlpariRA
Author

Tomasz Wisniewski
Axiory Global Ltd.
Tomasz was born in Warsaw, Poland on 25th October, 1985.


