![]() Tomasz Wisniewski
Tomasz Wisniewski
Axiory Global Ltd.
The beginning of the year is especially promising for the currencies from the antipodes: AUD and NZD. In the same time, we can see a bit of weakness in the common European currency, which automatically puts our attention on the possible bearish sentiment on the EURNZD. Is the sell signal there or our assumption is wrong?
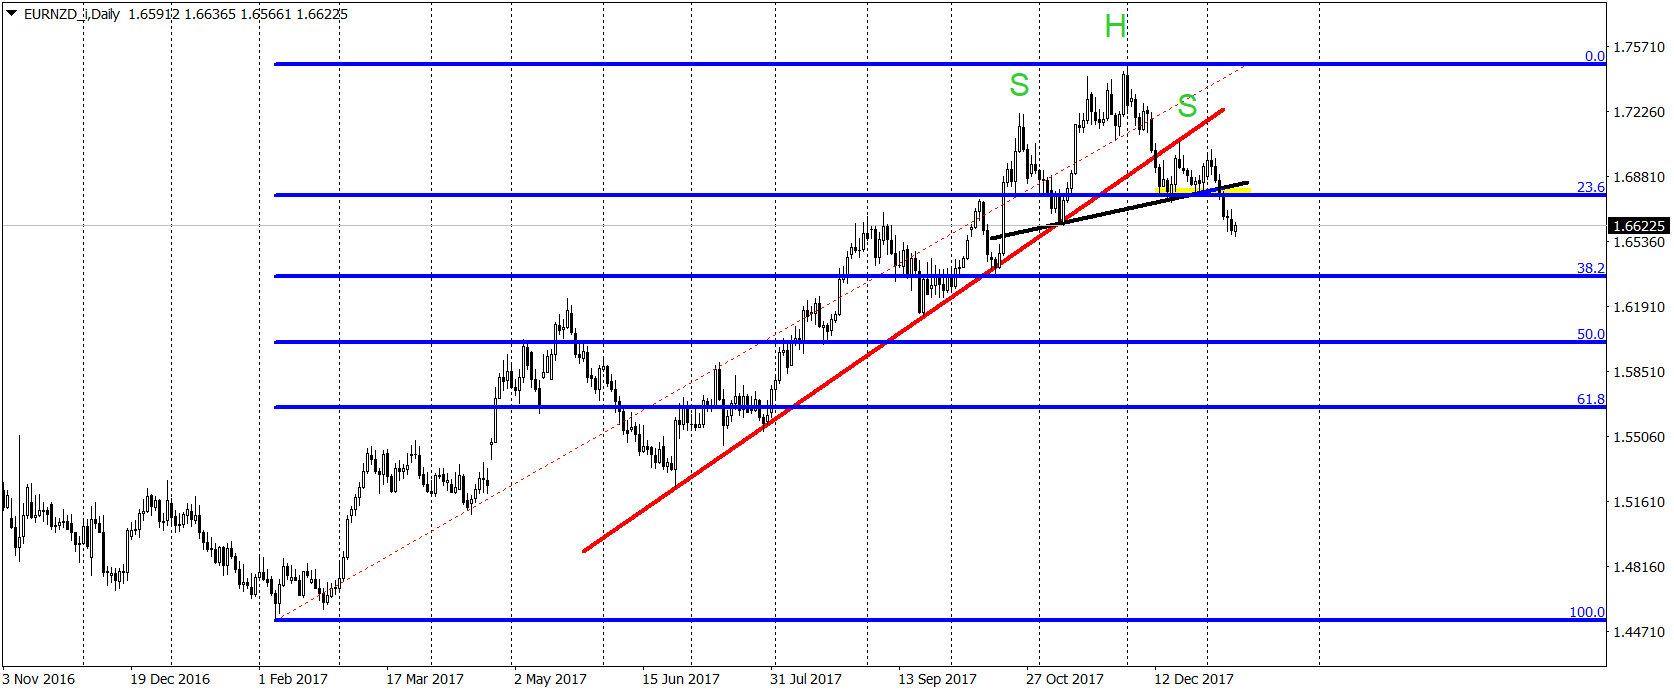
If we look on the chart, technical analysis is very clear about the current situation – it is bearish. For almost whole 2017, the price was climbing higher but during the last quarter of 2017, EURNZD created a strong reversal pattern – Head and Shoulders formation. (SHS). The formation is active because we already broke the neckline (black). What is more, in December, sellers managed to break the long-term up trendline (red) and in addition to that, they already tested it (with a success!), as a resistance. Last but not least, we managed to break the 23,6% Fibonacci.
As you can see, the technical analysis favours bears and promotes the scenario where price should test the 38,2% Fibonacci soon. That makes it a decent mid-term trading opportunity with a potential for 280 pips movement. Sell signal will be denied, once the price will come back above the 23,6% which for now is less likely to happen.
Follow us on Twitter @wisniewskifx and @AlpariRA
Trading FX/CFDs on margin bears a high level of risk, and may not be suitable for all investors. Before deciding to trade FX/CFDs you should carefully consider your investment objectives, level of experience, and risk appetite. You can sustain significant loss.
Recommended Content
Editors’ Picks
AUD/USD posts gain, yet dive below 0.6500 amid Aussie CPI, ahead of US GDP

The Aussie Dollar finished Wednesday’s session with decent gains of 0.15% against the US Dollar, yet it retreated from weekly highs of 0.6529, which it hit after a hotter-than-expected inflation report. As the Asian session begins, the AUD/USD trades around 0.6495.
USD/JPY finds its highest bids since 1990, approaches 156.00

USD/JPY broke into its highest chart territory since June of 1990 on Wednesday, peaking near 155.40 for the first time in 34 years as the Japanese Yen continues to tumble across the broad FX market.
Gold stays firm amid higher US yields as traders await US GDP data

Gold recovers from recent losses, buoyed by market interest despite a stronger US Dollar and higher US Treasury yields. De-escalation of Middle East tensions contributed to increased market stability, denting the appetite for Gold buying.
Ethereum suffers slight pullback, Hong Kong spot ETH ETFs to begin trading on April 30

Ethereum suffered a brief decline on Wednesday afternoon despite increased accumulation from whales. This follows Ethereum restaking protocol Renzo restaked ETH crashing from its 1:1 peg with ETH and increased activities surrounding spot Ethereum ETFs.
Dow Jones Industrial Average hesitates on Wednesday as markets wait for key US data

The DJIA stumbled on Wednesday, falling from recent highs near 38,550.00 as investors ease off of Tuesday’s risk appetite. The index recovered as US data continues to vex financial markets that remain overwhelmingly focused on rate cuts from the US Fed.