|

EURJPY - Looking to sell close to the reverse trend line resistance

Technical

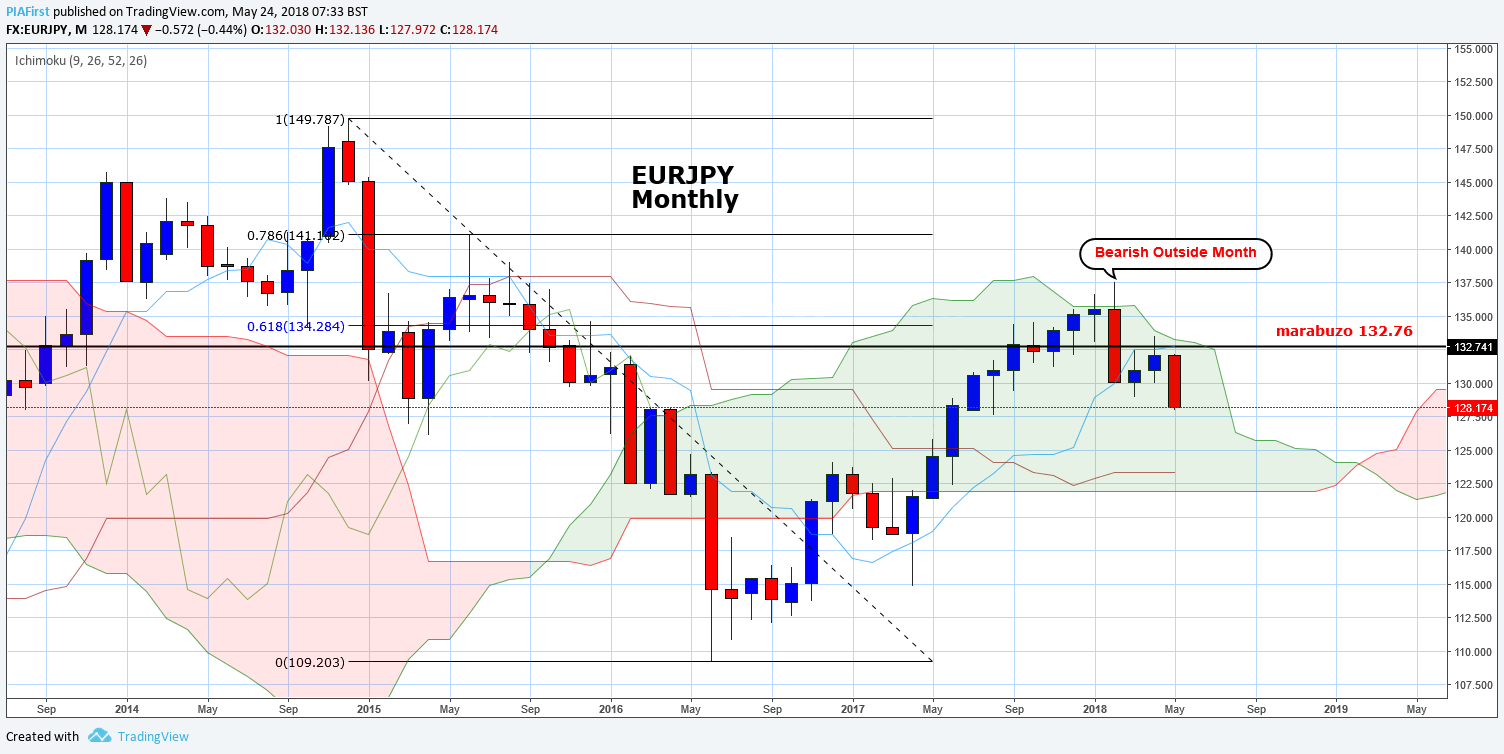
Monthly: Posted a bearish Outside Month in March. This pattern often highlights the top of a trend and the start of a new downward bias. The Marabuzo level (mid-point from open and close) is located at 132.76. Price action in April has seen sellers emerge above this level. Previous support level of 128.95 has been broken.

EURJPY

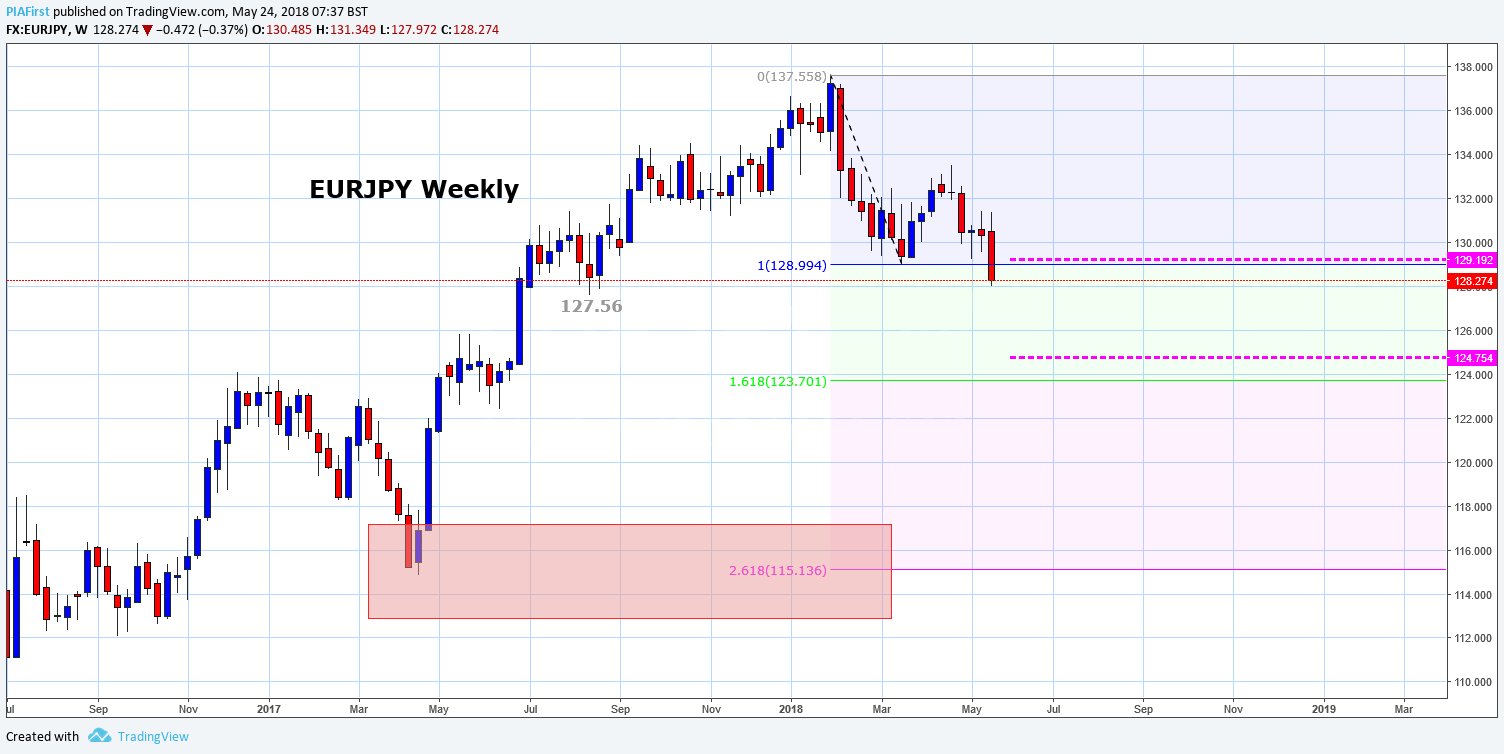
Weekly: A 261.8% extension level from the current trend (137.55-128.99) is located at 115.14. This is close to the April 2017 low trade at 114.85. A long-term target area. Bespoke support is located at 124.66, just above the 161.8% extension level. Previous support now becomes resistance at 129.00. Bespoke resistance is located at 129.22.

EURJPY

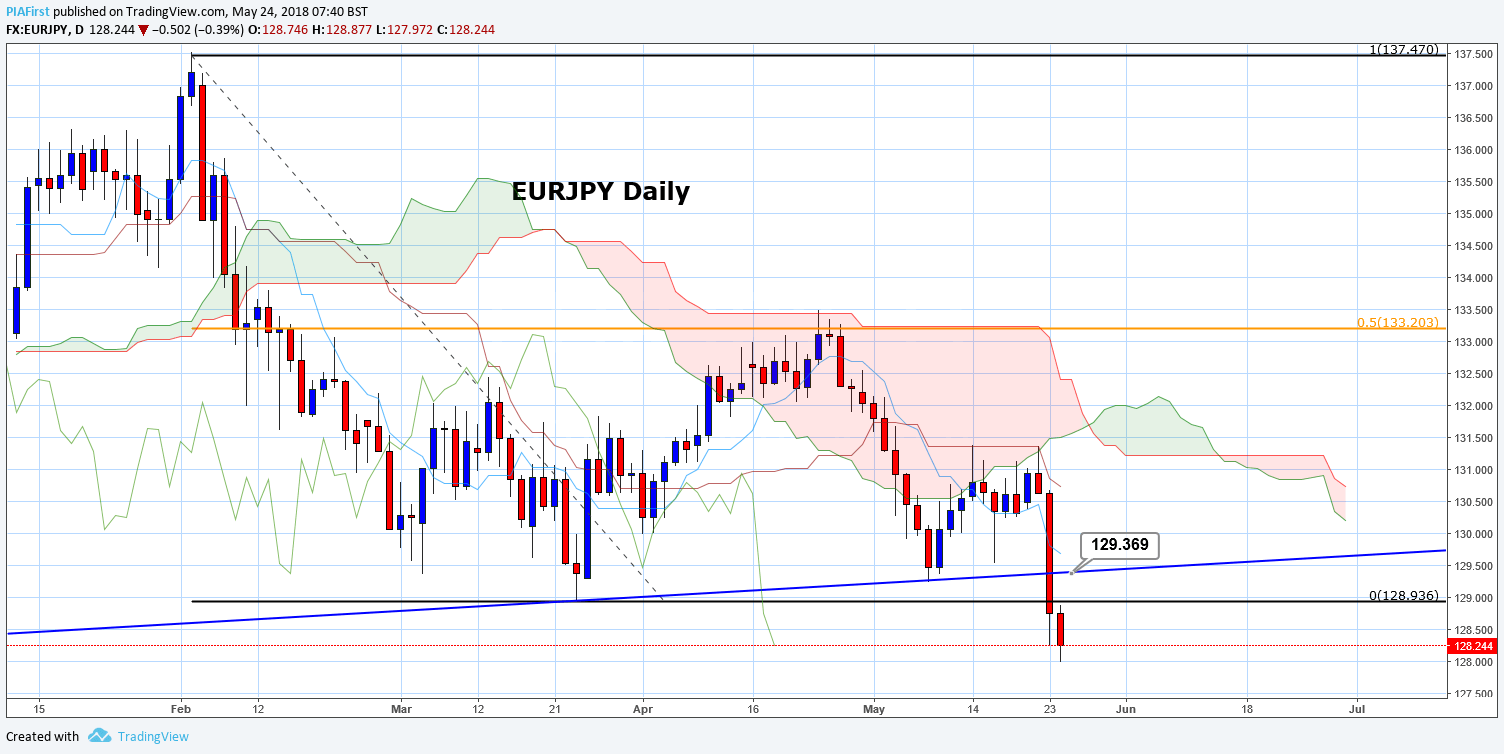
Daily: The 50% Fibonacci level is located at 133.22 (from 137.48-128.95). We have also seen a rejection of the Ichimoku Cloud top. The reverse trend line resistance from the trend of higher lows (blue line) is located at 129.36. With a stop placed above this are, selling rallies offers ample risk/reward.

EURJPY

We look to Sell at129.00

Stop: 130.50

Targets: 124.70


Article produced by Pia First for Orbex Limited
Visit PIA First for FX, Commodity & Stock Market trade ideas

Author

Ian Coleman

Ian Coleman

FXStreet

Ian started his financial career at the age of 18 working as a Junior Swiss Broker at Godsell Astley and Pearce (London). He quickly moved through the ranks and was Desk Manager at RP Martins at the age of 29.

More from Ian Coleman
Share:

Editor's Picks

EUR/USD tests nine-day EMA support near 1.1850

EUR/USD inches lower during the Asian hours on Monday, trading around 1.1870 at the time of writing. The 14-day Relative Strength Index momentum indicator at 56 stays above the midline, confirming improving momentum. RSI has cooled from prior overbought readings but stabilizes above 50, suggesting dips could stay limited before buyers reassert control.

GBP/USD flat lines as traders await key UK macro data and FOMC minutes

The GBP/USD pair kicks off a new week on a subdued note and oscillates in a narrow range, just below mid-1.3600s, during the Asian session. Moreover, the mixed fundamental backdrop warrants some caution for aggressive traders as the market focus now shifts to this week's important releases from the UK and the US.

Gold slides below $5,000 amid USD uptick and positive risk tone; downside seems limited

Gold attracts fresh sellers at the start of a new week and reverses a part of Friday's strong move up of over $150 from sub-$4,900 levels. The commodity slides back below the $5,000 psychological mark during the Asian session, though the downside potential seems limited amid a combination of supporting factors.

Bitcoin, Ethereum and Ripple consolidate within key ranges as selling pressure eases

Bitcoin and Ethereum prices have been trading sideways within key ranges following the massive correction. Meanwhile, XRP recovers slightly, breaking above the key resistance zone. The top three cryptocurrencies hint at a potential short-term recovery, with momentum indicators showing fading bearish signs.

Global inflation watch: Signs of cooling services inflation

Realized inflation landed close to expectations in January, as negative base effects weighed on the annual rates. Remaining sticky inflation is largely explained by services, while tariff-driven goods inflation remains limited even in the US.

Ripple Price Forecast: XRP potential bottom could be in sight

Ripple edges up above the intraday low of $1.35 at the time of writing on Friday amid mixed price actions across the crypto market. The remittance token failed to hold support at $1.40 the previous day, reflecting risk-off sentiment amid a decline in retail and institutional sentiment.