EURGBP Looking Ready to Cool Off as the Week Closes

Key Points:
-
Long-term wedge likely to put pressure on the pair moving forward.
-
A number of technical readings are shifting their bias to bearish.
-
An unclear fundamental forecast might see heightened technical trading.
The EURGBP is fast approaching what could prove to be another near-term peak for the pair which might see it make an about-face in the coming days. This apparent shift in bias is highlighted by a number of technical signals but, most notably, the presence of the long-term falling wedge structure. Ultimately, we don’t expect to see massive losses accrued but there could be some decent downside risk to capitalise on.
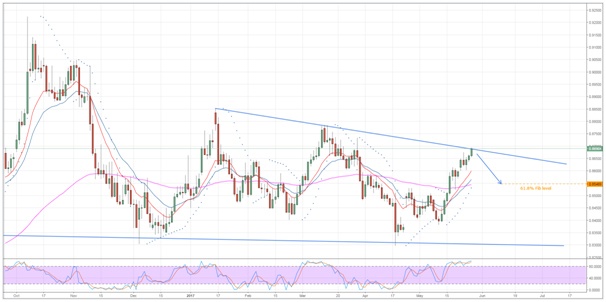
Starting with the long-term wedge, we can take a closer look at exactly what evidence we have to suggest losses are now coming down the line. As illustrated below, the upside of the wedge is currently being tested by the EURGBP and a reversal here is looking likely given the trend line forecasted by the January and March highs. However, as this trend of lower-highs has only been tested twice, it’s understandable to be somewhat sceptical that this is, in fact, a strong zone of resistance.
Luckily for us, we have a number of other technical signals on offer which also indicate that a downturn could be on the horizon. For one, the stochastics are deeply overbought and in sore need of being relieved by a near-term slip to the downside. What’s more, the ADX is barely registering that the recent upswing even counts as a weak trend – its reading hovering at around the 20.00 mark. Both of these instruments suggest that the bulls are nearly exhausted and that the mere presence of that declining trend line could be an effective cap on gains moving forward.
If we do indeed see a reversal, losses should be limited to around the 0.8546 level. This is predominantly due to the fact that this price represents the intersection of the 100 day moving average and the 61.8% Fibonacci level. Nevertheless, don’t discount the pair’s ability to sink below this handle as the EURGBP could invert its parabolic SAR reading here which would, in turn, help to keep the bulls out in force. The result of this would likely see the EURGBP move below its 100 day moving average and potentially even test the downside of the wedge.
Ultimately, our technical outlook is rather bearish moving ahead and we don’t have a strong fundamental reason to put this forecast into doubt. Regardless, keep half an eye on both the Brexit and Greek Debt Crises as they are likely to upset the balance of power between the EUR and the GBP moving ahead. Exactly which side of the quote will be favoured by any breaking news is not yet clear so, whilst we can speculate that we are going to see increased volatility, we may have to rely on the technical bias a bit more than usual which should mean losses are now on the cards.
Author

Matthew Ashley
Blackwell Global Investments Limited
Matthew joined Blackwell Global in March 2016; he works as a currency analyst in the research department based in Auckland.


