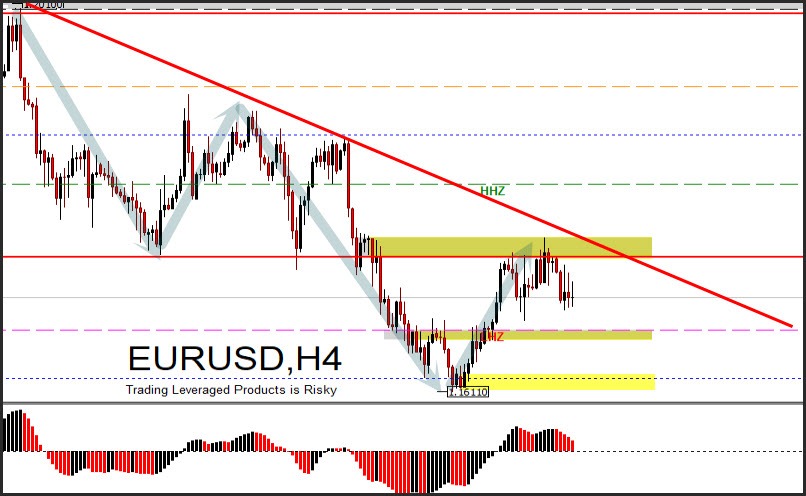
EUR/USD technical outlook: A break of the 1.1611 support could extend the decline

EURUSD intraday bias will likely remain neutral at the beginning of the week. A break of the resistance at 1.1769 will give an indication that the correction has been completed, and the intraday bias will return to the upside to retest 1.2010 if this break of resistance holds. On the downside, a break of the 1.1611 support could extend the decline from the short term peak at 1.2010 to 1.1494.
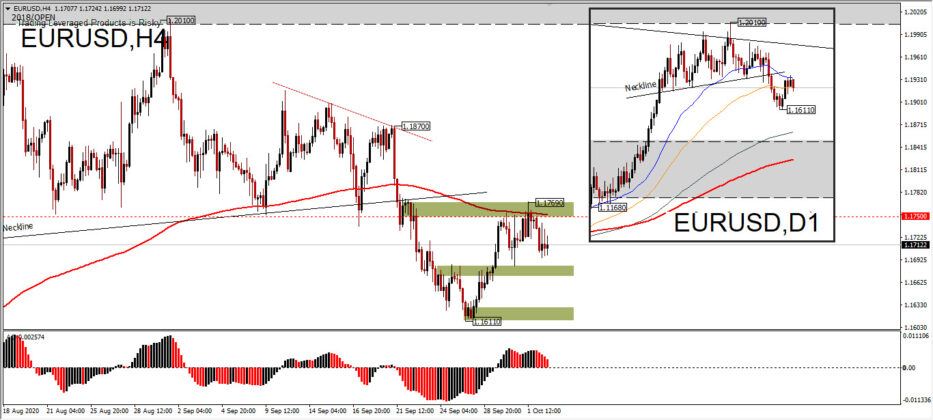
The movement of D1 is still under the neckline which was previously broken on September 22. Last week’s price was still stuck at the 26-day EMA, whereas at 4 hours, price resistance rose to the neckline, which is also the 200 EMA and the 61.8% retracement level which were drawn from the nearest peak 1.1870 and the new low 1.1611. Last week’s gains are still a corrective move of the downside structure, as long as 1.1769 holds as short-term resistance. A break of the minor support 1.1684 will bring a test of 1.1611.
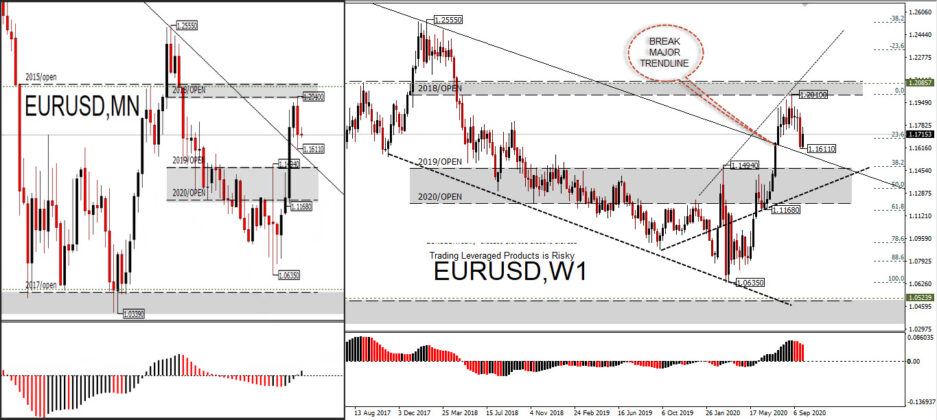
In higher timeframes, the rise from 1.0635 looks like the head of an unnatural inverse head and shoulder pattern, it also corresponds to the San Sen from the Sakata method introduced by Munehisa Homma in the 18th century. The rally’s further advance will test the quarterly level of 1.2250 with a continuation of peak resistance at 1.2500-55. However, it seems that it will take some considerable time to get there, considering that the current price structure tends to be corrective to test the support level 1.1494 or 1.1370. However, it should be noted that the price has managed to break out of the major descending trendline and is still above the 2019 opening price and below the 2018 opening price. The range between these annual openings will be a room for movement.