EUR/USD technical analysis summary

Sell Stop: Below 1.1542.

Stop Loss: Above 1.1606.

Indicator Signal
RSI Buy
MACD Sell
Donchian Channel Sell
MA(200) Sell
Fractals Neutral
Parabolic SAR Sell


EUR/USD chart analysis

EURUSD

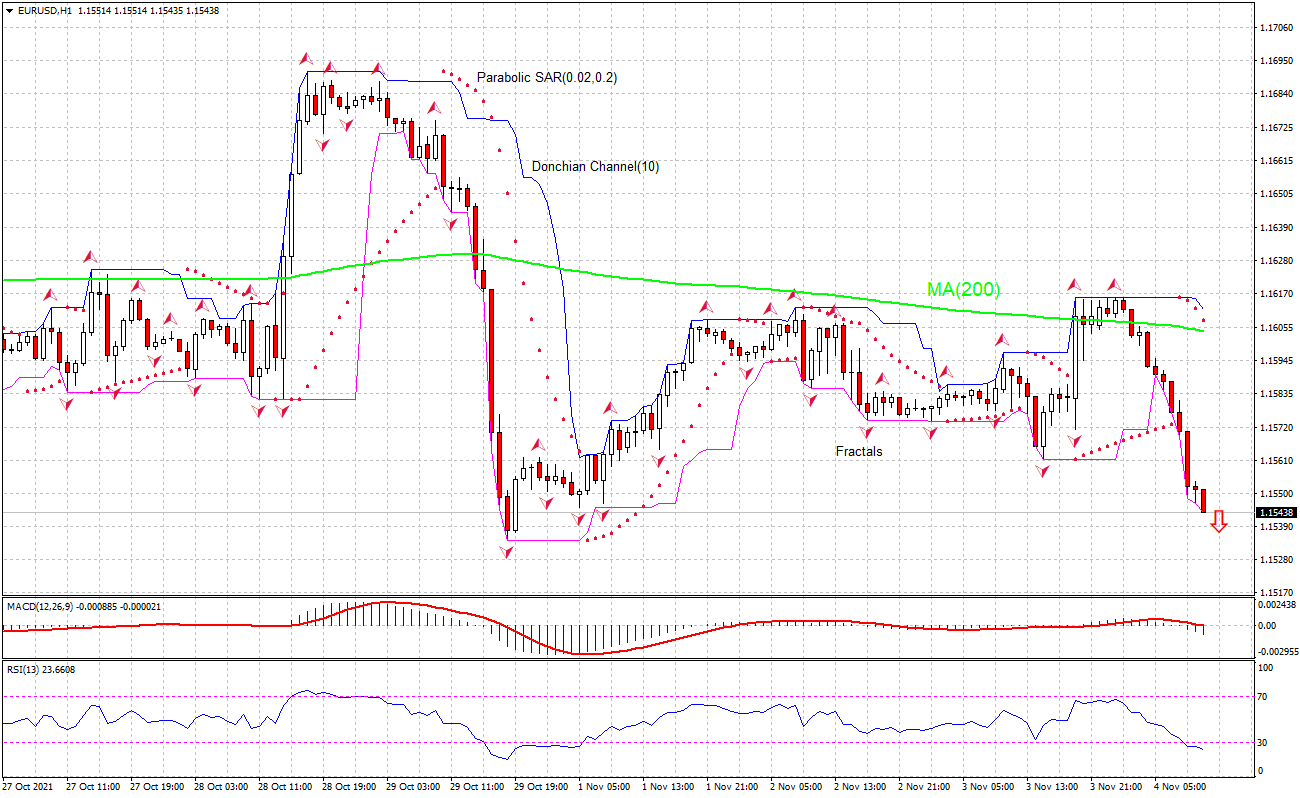
The technical analysis of the EURUSD price chart on a 1-hour timeframe shows EURUSD: H1 is retreating after testing the 200-period moving average MA(200) which is falling. We believe the bearish momentum will continue after the price breaches below the lower bound of the Donchian channel at 1.1542. A level below this can be used as an entry point for placing a pending order to sell. The stop loss can be placed above 1.1606. After placing the order, the stop loss is to be moved to the next fractal high indicator, following Parabolic signals. Thus, we are changing the expected profit/loss ratio to the breakeven point. If the price meets the stop loss level without reaching the order, we recommend canceling the order: the market has undergone internal changes which were not taken into account.

Fundamental analysis of forex – EUR/USD

German factory orders growth was smaller than expected in September. Will the EURUSD price continue retreating?

German factory orders growth was smaller than expected in September. The statistics office Destatis reported German factory orders rose 1.3% over the month in September after an 8.8% drop in August when a 1.7% growth was forecast. This is bearish for EURUSD.


Want to get more free analytics? Open Demo Account now to get daily news and analytical materials.

This overview has an informative character and is not financial advice or a recommendation. IFCMarkets. Corp. under any circumstances is not liable for any action taken by someone else after reading this article.

Recommended Content


Recommended Content

Editors’ Picks

EUR/USD trades with negative bias, holds above 1.0700 as traders await US PCE Price Index

EUR/USD trades with negative bias, holds above 1.0700 as traders await US PCE Price Index

EUR/USD edges lower during the Asian session on Friday and moves away from a two-week high, around the 1.0740 area touched the previous day. Spot prices trade around the 1.0725-1.0720 region and remain at the mercy of the US Dollar price dynamics ahead of the crucial US data.

EUR/USD News

USD/JPY jumps above 156.00 on BoJ's steady policy

USD/JPY jumps above 156.00 on BoJ's steady policy

USD/JPY has come under intense buying pressure, surging past 156.00 after the Bank of Japan kept the key rate unchanged but tweaked its policy statement. The BoJ maintained its fiscal year 2024 and 2025 core inflation forecasts, disappointing the Japanese Yen buyers. 

USD/JPY News

Gold price flatlines as traders look to US PCE Price Index for some meaningful impetus

Gold price flatlines as traders look to US PCE Price Index for some meaningful impetus

Gold price lacks any firm intraday direction and is influenced by a combination of diverging forces. The weaker US GDP print and a rise in US inflation benefit the metal amid subdued USD demand. Hawkish Fed expectations cap the upside as traders await the release of the US PCE Price Index.

Gold News

Sei Price Prediction: SEI is in the zone of interest after a 10% leap

Sei Price Prediction: SEI is in the zone of interest after a 10% leap

Sei price has been in recovery mode for almost ten days now, following a fall of almost 65% beginning in mid-March. While the SEI bulls continue to show strength, the uptrend could prove premature as massive bearish sentiment hovers above the altcoin’s price.

Read more

US economy: Slower growth with stronger inflation

US economy: Slower growth with stronger inflation

The US Dollar strengthened, and stocks fell after statistical data from the US. The focus was on the preliminary estimate of GDP for the first quarter. Annualised quarterly growth came in at just 1.6%, down from the 2.5% and 3.4% previously forecast.

Read more

Majors

Cryptocurrencies

Signatures