Technical analysis: Will the EUR/USD price continue retreating?

EUR/USD technical analysis summary
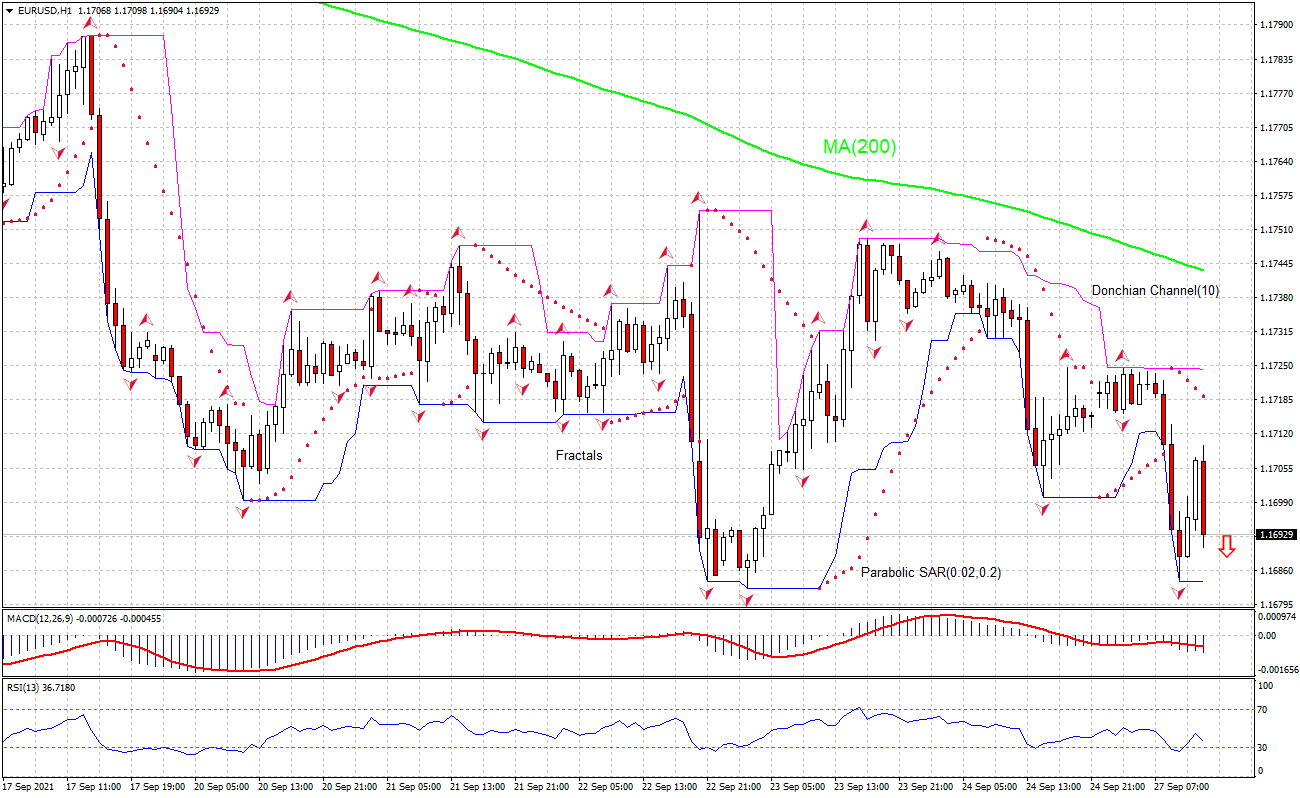
Sell Stop: Below 1.1684.
Stop Loss: Above 1.1724.
| Indicator | Signal |
| RSI | Neutral |
| MACD | Sell |
| Donchian Channel | Neutral |
| MA(200) | Sell |
| Fractals | Neutral |
| Parabolic SAR | Sell |
EUR/USD chart analysis
EUR/USD technical analysis
The technical analysis of the EURUSD price chart on 1-hour timeframe shows EURUSD: H1 is retracing down following a rebound from three-day low under the 200-period moving average MA(200) which is falling. We believe the bearish momentum will continue after the price breaches below the lower bound of the Donchian channel at 1.1684. A level above this can be used as an entry point for placing a pending order to sell. The stop loss can be placed above 1.1724. After placing the order, the stop loss is to be moved to the next fractal high, following Parabolic signals . Thus, we are changing the expected profit/loss ratio to the breakeven point. If the price meets the stop loss level without reaching the order, we recommend cancelling the order: the market has undergone internal changes which were not taken into account.
Fundamental analysis of forex - EUR/USD
Euro zone money supply continued to rise in August. Will the EURUSD price continue retreating? Euro zone money supply continued to rise in August. The European Central Bank reported euro zone money supply M3 rose 7.9% over year in August after 7.6% increase in July, when a 7.8% growth was expected. This is bearish for EURUSD.
Want to get more free analytics? Open Demo Account now to get daily news and analytical materials.
Want to get more free analytics? Open Demo Account now to get daily news and analytical materials.
Author

Dmitry Lukashov
IFC Markets
Dimtry Lukashov is the senior analyst of IFC Markets. He started his professional career in the financial market as a trader interested in stocks and obligations.


