EUR/USD Showing Positive Signs Above 100 SMA

Key Highlights
-
The Euro started a strong rebound after trading as low as 1.1183 against the US Dollar.
-
A crucial bullish trend line is formed with support at 1.1250 on the 4-hours chart of EUR/USD.
EURUSD Technical Analysis
Looking at the 4-hours chart, the pair even broke the 1.1265 and 1.1280 resistance levels. An intermediate swing low was formed at 1.1229 and later the pair settled above the 100 simple moving average (4-hours, red).
Finally, the price traded above the 1.1300 level before running into the 1.1320-1.1340 resistance area. Recently, it corrected lower below the 23.6% Fib retracement level of the last wave from the 1.1229 low to 1.1323 high.
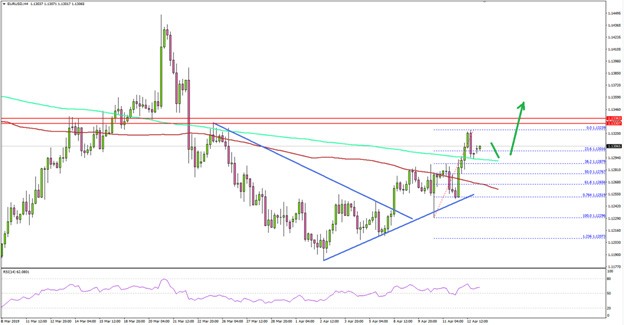
On the downside, there are many supports near the 1.1275 and 1.1265 levels. The 50% Fib retracement level of the last wave from the 1.1229 low to 1.1323 high is also near 1.1276 to act as a support.
More importantly, there is a crucial bullish trend line is formed with support at 1.1250 on the 4-hours chart of EUR/USD. Therefore, the pair remains supported on dips near the trend line and the 100 SMA.
Author

Aayush Jindal
TitanFX
I have spent over six years as a financial markets contributor and observer, and possess strong technical analytical skills. I am a software engineer by profession, loves blogging and observing financial markets.


