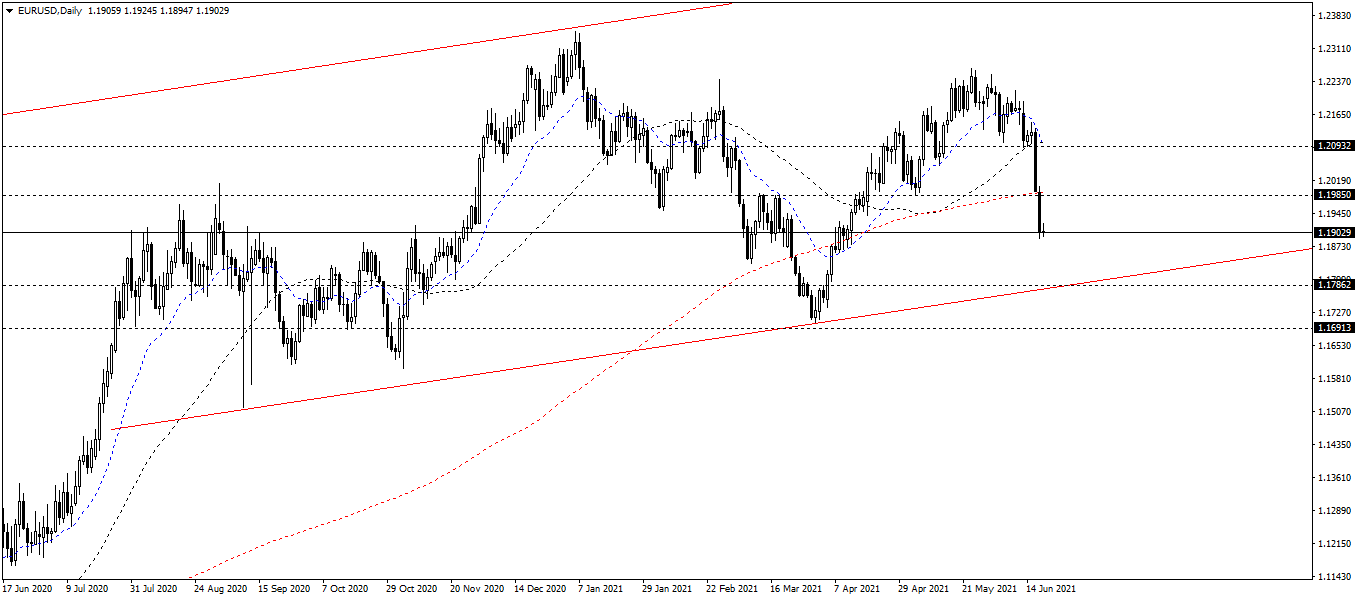
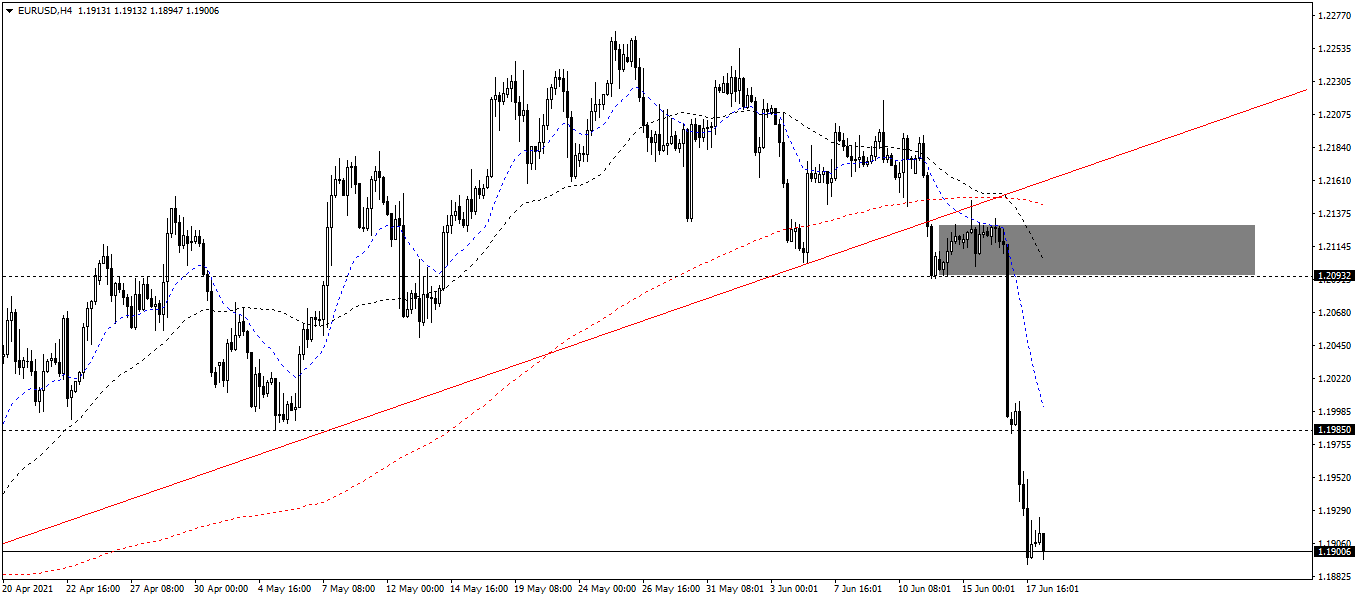
EUR/USD: Reaching the support 1.190, the bears is still on

Resistance/support analysis
The resistances are 1.198 and 1.209.
The supports are 1.178 and 1.170.
Moving average analysis
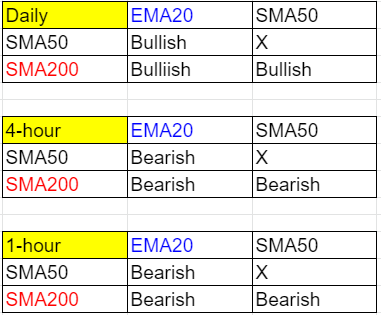
On the daily chart, both the EMA20/SMA50 are above the SMA200, showing bullish signal.
On the 4-hour chart, both the EMA20/SMA50 crossed the SMA200 and went down, showing bearish trend. In the mid-term, the bears is dominating this chart.
On the 1-hour chart, both the EMA20/SMA50 make a significant distance from the SMA200.

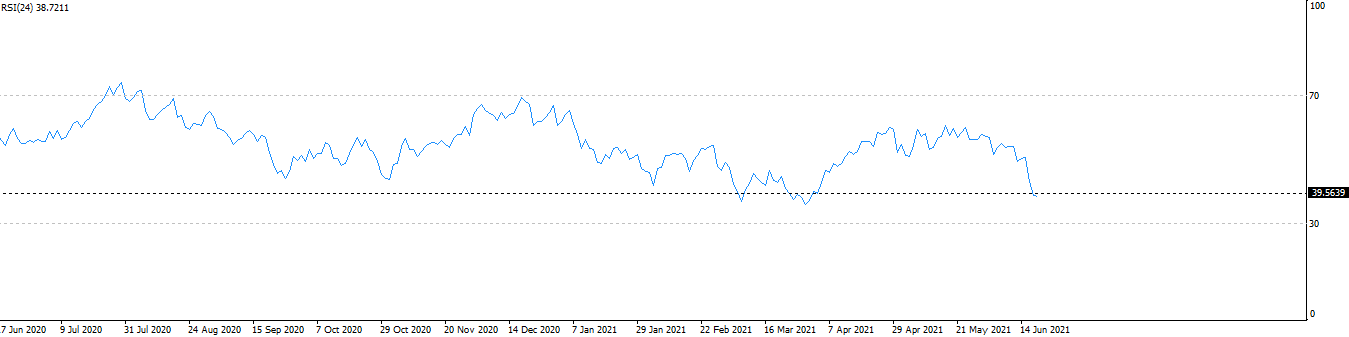
RSI analysis
On the daily chart, the RSI indicator shows a bearish signal which stops at 38.46. This means EUR/USD is on the bearish side.
Author

Thang Le
Independent Analyst
Thang Le is founder and owner of PSK - a financial community in Vietnam which at: Advising on strategic investment for individuals; Supporting the development of the investment community. He is Financial Analyst at Lion Group Hol


