EUR/USD Price Forecast: Waiting for US employment figures

EUR/USD Current price: 1.1648
- The Hamburg Commercial Bank downwardly revised the EU August PMI.
- The United States starts releasing employment-related data ahead of the NFP on Friday.
- EUR/USD is neutral-to-bearish, selling interest to resume once below 1.1590.
The EUR/USD pair trades around the 1.1650 area, finding some stability after Tuesday’s wild movements. The pair fell to a fresh one-week low of 1.1608 early in the European session, recovering afterwards. Financial markets remain cautious amid turmoil in global government bonds following record yields in the United Kingdom (UK) long-term gilts on Tuesday.
On the data front, the Eurozone published the July Producer Price Index (PPI), which rose at an annualized pace of 0.4%, higher than the 0.2% anticipated yet below the 0.8% posted in June. Also, the Hamburg Commercial Bank (HCOB) released the final estimate of the August Composite and Services Purchasing Managers’ Indexes (PMI). The EU services PMI was downwardly revised to 51 from a preliminary estimate of 51.1. As a result, the Composite PMI was confirmed at 50.5, below the 50.7 previously calculated.
Across the pond, the United States (US) published MBA Mortgage Applications, down 1.2% following a 0.5% decline. The American session will bring July Factory Orders and the July JOLTS Job Openings report. Other than that, a couple of Federal Reserve (Fed) officials will be on the wires.
The US will start releasing a slew of employment-related data, ahead of the Nonfarm Payrolls (NFP) report scheduled for Friday. The ADP Employment Change report will be out on Thursday, delayed amid the Labor Day holiday on Monday.
EUR/USD short-term technical outlook
From a technical point of view, the EUR/USD pair is still at risk of falling. The daily chart shows it hovers in a well-limited range while the upside is being contained by a flat 20 Simple Moving Average (SMA) at around 1.1665. The same chart shows technical indicators stand lifeless around their midlines, while the 100 and 200 SMAs keep grinding north, far below the current level.
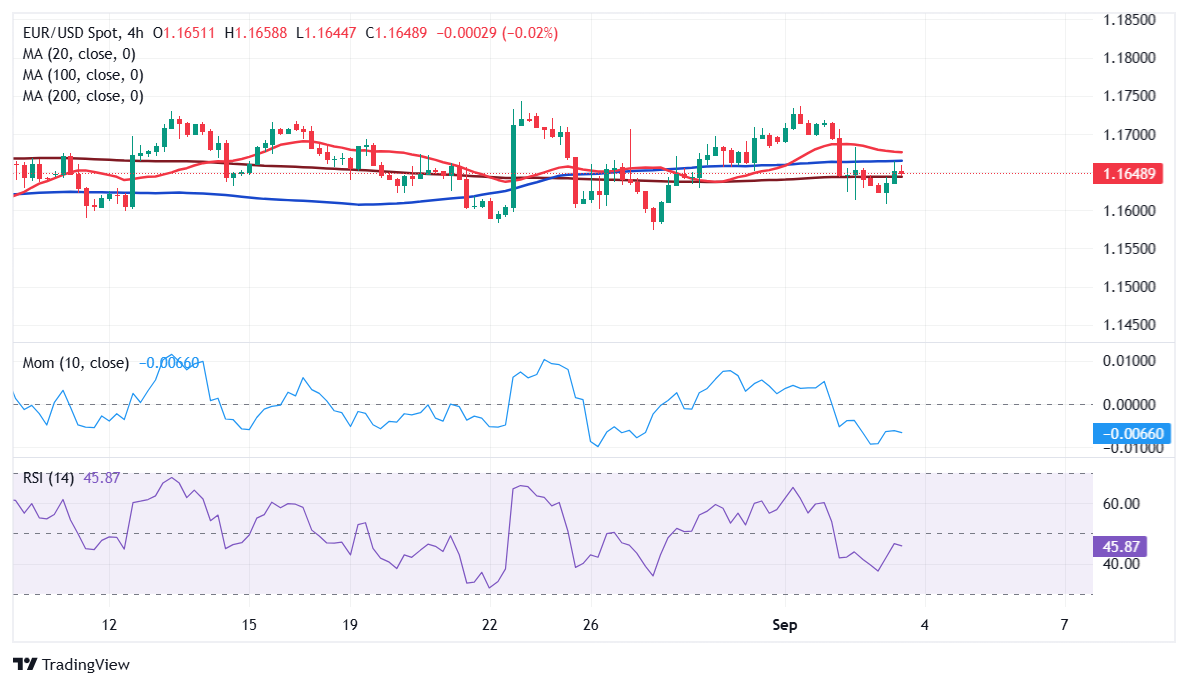
In the near term, and according to the 4-hour chart, EUR/USD is well contained between directionless moving averages. The 200 SMA provides support around the daily low, while the 100 SMA stands at around 1.6065. Other than that, technical indicators develop within negative levels, with modest downward slopes, not enough to confirm an upcoming slide but reflecting the market’s sentiment.
Support levels: 1.1620 1.1590 1.1550
Resistance levels: 1.1665 1.1700 1.1745
Premium
You have reached your limit of 3 free articles for this month.
Start your subscription and get access to all our original articles.
Author

Valeria Bednarik
FXStreet
Valeria Bednarik was born and lives in Buenos Aires, Argentina. Her passion for math and numbers pushed her into studying economics in her younger years.


