EUR/USD Price Forecast: Tepid US employment data pushes the US Dollar up

EUR/USD Current price: 1.1631
- Dismal United States data fueled demand for the USD early in the American session.
- Market participants await the US ISM Services Purchasing Managers’ Index.
- EUR/USD is under mild selling pressure, strong support at 1.1590.
The EUR/USD pair spent the first half of the day confined to a tight intraday range, stuck around the 1.1650 area. The US Dollar (USD) pushed marginally higher against most major rivals amid continued caution among market participants ahead of United States (US) macro releases.
Meanwhile, the Euro (EU) had no reason to advance. Eurozone Retail Sales were down 0.5% in July, easing from the 0.6% gain posted in June and worse than the -0.2% anticipated by market participants. Retail Sales annual gain was 2.2%, below the 2.4% forecast and the previous 3.5%.
The first batch of US data was pretty discouraging. The country released August Challenger Job Cuts, which showed that US-based employers announced 85,979 job cuts in August, up 39% from the 62,075 figure announced in July, and the highest monthly reading since 2020. Also, the ADP Employment Change report showed that the private sector added a modest 54,000 new job positions in the same month, much worse than the revised 106,000 from July and worse than the 65,000 anticipated.
Initial Jobless Claims for the week ended August 31 rose to 237,000 from the previous 229,000 and worse than the 230,000 expected, while the July Goods and Services Trade Balance posted a deficit of $ 78.3 billion, worsening from $60.2 billion in June. Finally, Nonfarm Productivity in Q2 rose by 3.3%, better than the 2.4% expected, while Unit Labor Cost in the same period was up 1%.
The USD found fresh bids with the news, pushing EUR/USD towards the fresh daily lows in the 1.1630 price zone. Coming up next is the ISM Services Purchasing Managers’ Index (PMI), foreseen at 51 in August, better than the 50.1 posted in July.
EUR/USD short-term technical outlook
The daily chart for the EUR/USD pair shows the risk remains skewed to the downside. A flat 20 Simple Moving Average (SMA) at around 1.1665 keeps providing resistance and containing advances, while technical indicators grind lower right below their midlines. The 100 SMA keeps losing its bullish strength, turning flat at around 1.1520 and becoming a potential target should the USD extend its advance.
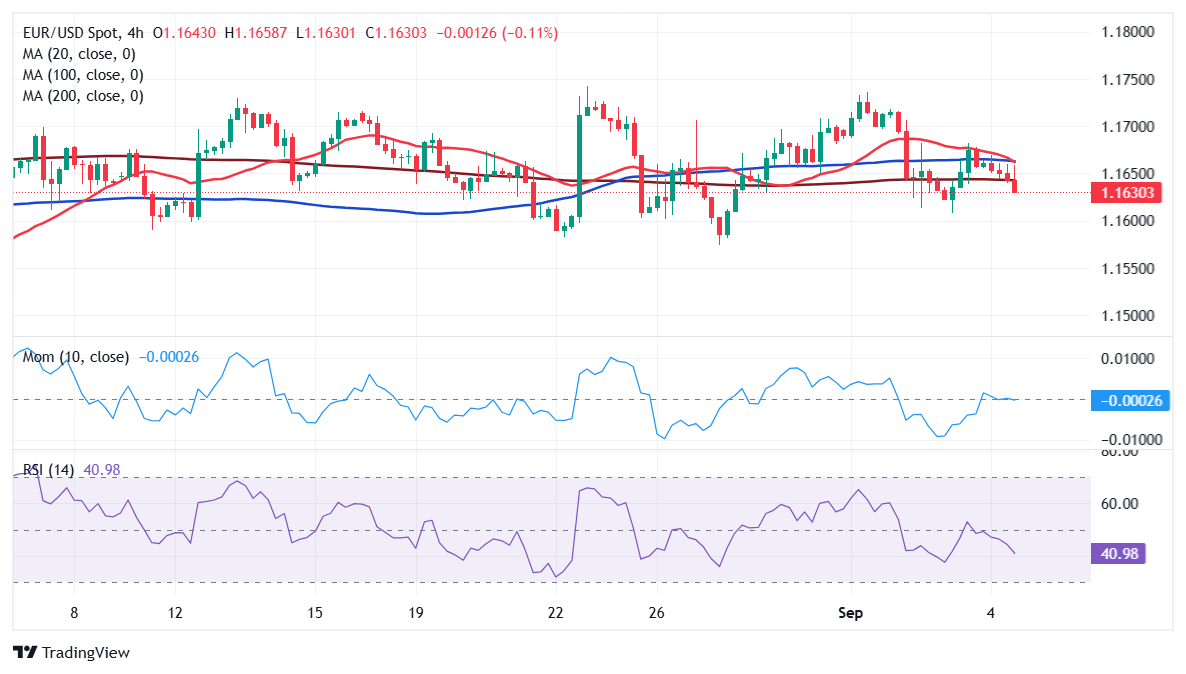
The near-term picture is bearish. In the 4-hour chart, EUR/USD is developing below all its moving averages, which, anyway, remain confined to a tight range. The 20 SMA gains downward traction above directionless longer ones, usually a sign of increasing selling interest. Finally, technical indicators gain downward traction within negative levels, in line with lower lows ahead.
Support levels: 1.1620 1.1590 1.1550
Resistance levels: 1.1665 1.1700 1.1745
Premium
You have reached your limit of 3 free articles for this month.
Start your subscription and get access to all our original articles.
Author

Valeria Bednarik
FXStreet
Valeria Bednarik was born and lives in Buenos Aires, Argentina. Her passion for math and numbers pushed her into studying economics in her younger years.


