EUR/USD Price Forecast: Outstanding US employment data fuels USD demand

EUR/USD Current price: 1.1729
- The June Nonfarm Payroll report surprised with upbeat figures, Unemployment Rate at 4.1%.
- US President Donald Trump attacked Fed Chair Powell, demanding his resignation.
- EUR/USD turned bearish in the near term, may pierce the 1.1700 figure.
The EUR/USD pair traded uneventfully throughout the first half of the day, stuck a handful of pips below the 1.1800 mark, as market players hold back ahead of the release of the United States (US) Nonfarm Payrolls (NFP) report.
In the meantime, and ahead of the release, US President Donald Trump once again took it on Federal Reserve (Fed) Chair Jerome Powell. “Too Late should resign immediately!!!”, Trump posted on Truth Social. Trump wants the Fed to lower interest rates to help boost economic growth, while Powell refuses to do so amid the uncertainty surrounding the impact of tariffs on inflation.
The NFP report came out and showed the country added 147K new positions in June, much better than the 110K expected. The Unemployment Rate, in the meantime, edged lower to 4.1% from 4.2%, better than the 4.3% expected, while the Labor Force Participation Rate ticked down to 62.3% from 62.4%.
Finally, annual wage inflation, as measured by the change in the Average Hourly Earnings, retreated to 3.7% from 3.8% in May, which was softer than anticipated. The outstanding positive surprise triggered USD demand across the FX board, sending EUR/USD towards the 1.1710 price zone.
Other than that, the US released Initial Jobless Claims, which rose by 233K in the week ended June 28, beating expectations. On a negative note, the May Goods Trade Balance posted a deficit of $97.5 billion, worse than the previous estimate of $.96.6 billion.
EUR/USD short-term technical outlook
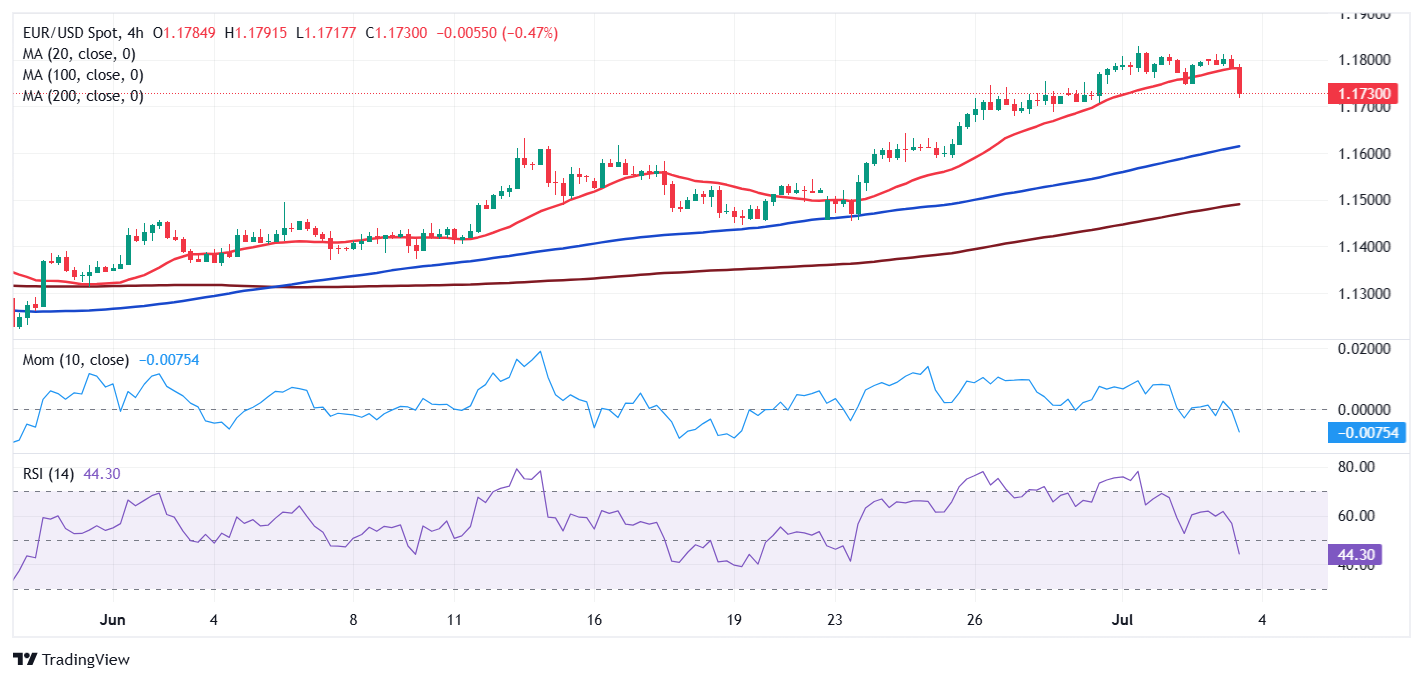
The EUR/USD pair trades near its intraday low, and the daily chart shows the corrective slide may continue. The Relative Strength Index (RSI) indicator heads firmly south, abandoning overbought territory. The Momentum indicator also aims lower, yet without enough strength and still within positive levels. Finally, the pair remains far above bullish moving averages, with the 20 Simple Moving Average (SMA) currently in the 1.1580 price zone.
Technical readings in the 4-hour chart support a downward extension. The pair broke below its 20 SMA, while technical indicators head south almost vertically within negative levels. The 100 and 200 SMAs, in the meantime, maintain their strong bullish slopes far below the current level.
Support levels: 1.1695 1.1650 1.1610
Resistance levels: 1.1745 1.1790 1.1830
Premium
You have reached your limit of 3 free articles for this month.
Start your subscription and get access to all our original articles.
Author

Valeria Bednarik
FXStreet
Valeria Bednarik was born and lives in Buenos Aires, Argentina. Her passion for math and numbers pushed her into studying economics in her younger years.