EUR/USD Price Forecast: Limited bullish scope amid market’s optimism

EUR/USD Current price: 1.1126
- Economic Sentiment in Germany and the Eurozone improved according to the ZEW Survey.
- The United States Consumer Price Index rose at a softer-than-anticipated pace in April.
- EUR/USD extends its consolidative phase around 1.1100, bullish potential limited.
The EUR/USD pair spent the first half of the day consolidating around the 1.1100 figure, holding ground ahead of the United States (US) Consumer Price Index (CPI) release.
Not even German data was enough to move the pair, as the country released the ZEW Survey on Economic Sentiment, which improved in May to 25.2 from -14 in April. The assessment of the current situation, however, deteriorated from the previous -81.2 to -82, missing expectations of -77. Finally, the survey showed that Economic Sentiment in the Eurozone (EU) improved to 11.6 after posting -18.5 in the previous month.
Other than that, Asian and European indexes maintained the positive tone triggered by news that the US and China began de-escalating the trade war, by reducing massive tariffs for 90 days.
US inflation data was finally out. The CPI rose by 2.3% in the twelve months to April, slightly below the expected and the previous 2.4%. The core annual reading, however, remained steady at 2.8%. On a monthly basis, the CPI was up 0.2%, higher than the -0.1% previous yet below the 0.3% expected.
The US Dollar (USD) ticked marginally lower with the news, yet the reaction was quite limited, given that the figures do not change the Federal Reserve (Fed) stance on monetary policy.
EUR/USD short-term technical outlook
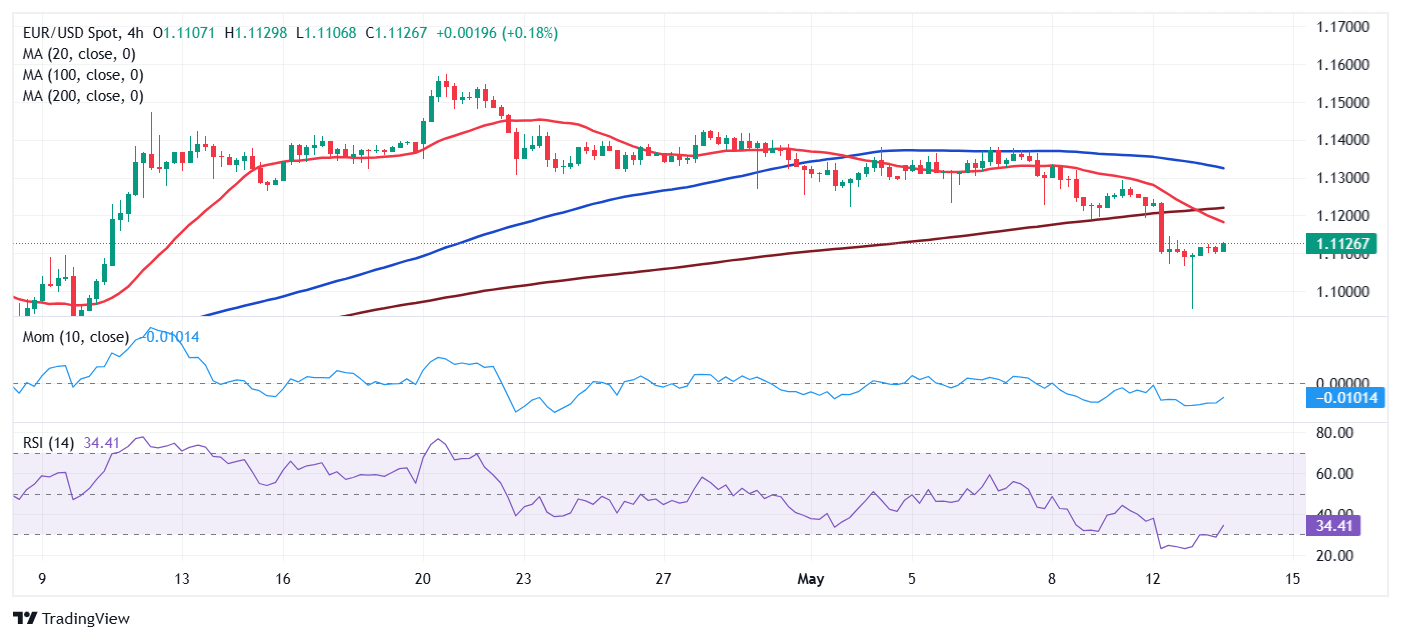
From a technical point of view, the daily chart for the EUR/USD pair shows it is confined at the lower end of Monday’s range. The pair keeps trading well below a bearish 20 Simple Moving Average (SMA) while above the 100 and 200 SMAs, which stand over 300 pips below the current level. Finally, technical indicators ticked higher, but remain within negative levels, not enough to anticipate another leg north.
The near-term picture is bearish. EUR/USD trades below all its moving averages in the 4-hour chart, with the 20 SMA crossing below the 200 SMA in the 1.1200 region. Technical indicators, in the meantime, corrected oversold conditions before turning flat within negative levels, suggesting buyers are not interested.
Support levels: 1.1070 1.1025 1.0990
Resistance levels: 1.1150 1.1195 1.1240
Premium
You have reached your limit of 3 free articles for this month.
Start your subscription and get access to all our original articles.
Author

Valeria Bednarik
FXStreet
Valeria Bednarik was born and lives in Buenos Aires, Argentina. Her passion for math and numbers pushed her into studying economics in her younger years.


