EUR/USD Current price: 1.1325
- United States political and fiscal woes put the US Dollar in selling mode.
- The European Central Bank warned about the risks the economy faces.
- EUR/USD holds on to gains above 1.1300, needs fresh impetus to break higher.

The EUR/USD pair is firmly up for a third consecutive day on Wednesday, reaching the 1.1360 price zone during European trading hours amid persistent US Dollar (USD) weakness.
Tariffs and tax-related headlines coming from the United States (US) are taking their toll on the Greenback. On the one hand, tensions between Washington and China arose amid the US Warning companies against using AI chips made by Huawei. China’s Commerce Minister accused the US of “abusing export controls to suppress and contain China.” Additionally, US-Japan talks seem stuck as the latter demands that the US eliminate tariffs, while noting the country is in no rush to clinch a deal.
On the other hand, the US Congress started debating US President Donald Trump’s tax bill on Tuesday, aiming for tax cuts, which some analysts believe will increase the already skyrocketing government debt.
Across the pond, the European Central Bank (ECB) released the Financial Stability Review report, showing policymakers believe inventors might be underestimating the risk that the economy performs worse than expected, trade tensions escalate, or an expected easing of monetary policy fails to materialise. Even further, the ECB described tariffs as “major downside risk.”
Other than that, the focus remains on a slew of Federal Reserve (Fed) speakers that have been flooding the news feeds since the beginning of the week. Generally speaking, Fed officials maintain the hawkish tilt, with their words having no new impact on the USD.
Finally, it's worth adding that Wall Street closed in the red on Tuesday, and given the aforementioned concerns, it aims for another negative day.
EUR/USD short-term technical outlook
The EUR/USD pair trades at around 1.1320, and the daily chart shows it run past a now flat 20 Simple Moving Average (SMA) providing support at around 1.1275. The same chart shows the 100 SMA is about to cross above the 200 SMA, both far below the current level, hinting at a more sustained bullish run. Finally, technical indicators are crossing their midlines into positive territory, not enough to confirm a strong rally yet.
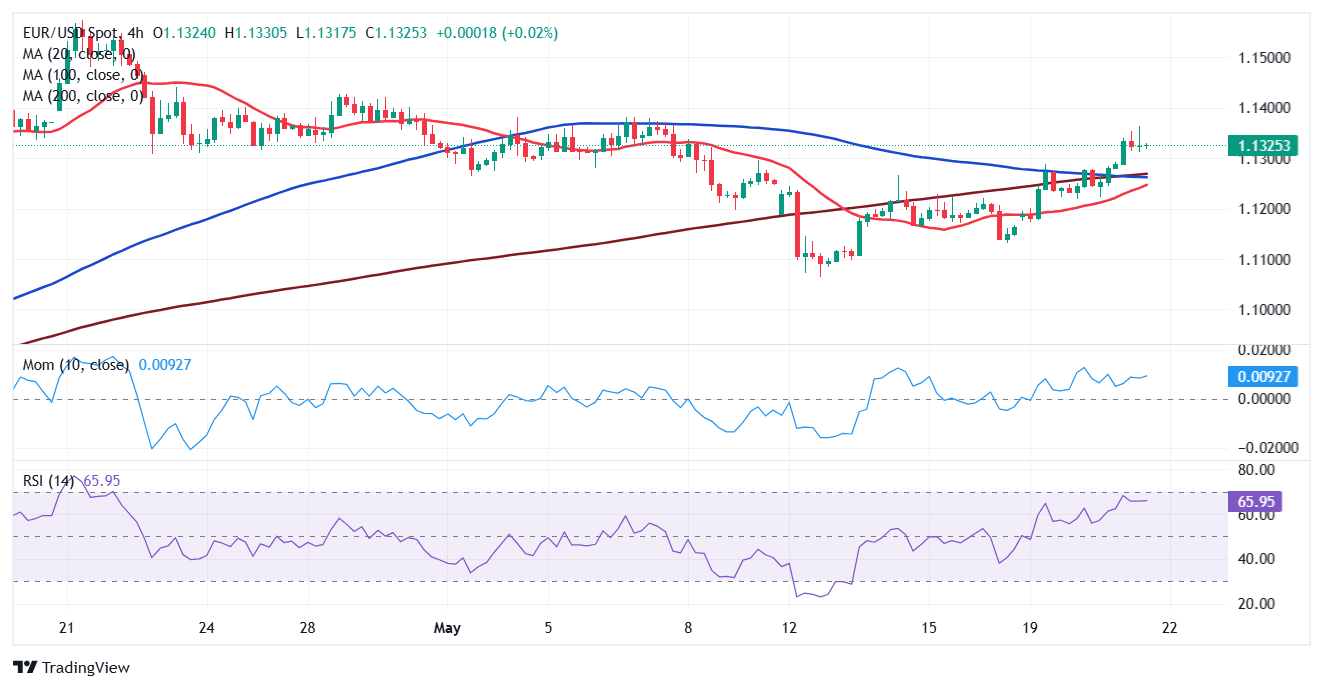
In the near term, and according to the 4-hour chart, the risk skews to the upside, although the positive momentum eased. The pair trades above all its moving averages, with the 20 SMA gaining upward strength below directionless 100 and 200 SMAS. Technical indicators, in the meantime, turned flat well above their midlines, suggesting selling interest is well-limited.
Support levels: 1.1275 1.1240 1.1200
Resistance levels: 1.1360 1.1400 1.1440
Information on these pages contains forward-looking statements that involve risks and uncertainties. Markets and instruments profiled on this page are for informational purposes only and should not in any way come across as a recommendation to buy or sell in these assets. You should do your own thorough research before making any investment decisions. FXStreet does not in any way guarantee that this information is free from mistakes, errors, or material misstatements. It also does not guarantee that this information is of a timely nature. Investing in Open Markets involves a great deal of risk, including the loss of all or a portion of your investment, as well as emotional distress. All risks, losses and costs associated with investing, including total loss of principal, are your responsibility. The views and opinions expressed in this article are those of the authors and do not necessarily reflect the official policy or position of FXStreet nor its advertisers. The author will not be held responsible for information that is found at the end of links posted on this page.
If not otherwise explicitly mentioned in the body of the article, at the time of writing, the author has no position in any stock mentioned in this article and no business relationship with any company mentioned. The author has not received compensation for writing this article, other than from FXStreet.
FXStreet and the author do not provide personalized recommendations. The author makes no representations as to the accuracy, completeness, or suitability of this information. FXStreet and the author will not be liable for any errors, omissions or any losses, injuries or damages arising from this information and its display or use. Errors and omissions excepted.
The author and FXStreet are not registered investment advisors and nothing in this article is intended to be investment advice.
Recommended Content
Editors’ Picks

EUR/USD moves in a consolidative theme near 1.1570
Following multi-year highs north of the 1.1600 barrier, EUR/USD now looks range bound around the 1.1570 zone as the NA session draws to a close on Thursday. The strong upside in the pair came on the back of broad-based decline in the US Dollar, which was particularly sponsored by lower US inflation data, further cooling of the labour market, and prospects of further rate cuts by the Fed.

GBP/USD looks bullish just below 1.3600
GBP/USD maintains its constructive stance in place in the latter part of Thursday’s session, hovering just below 1.3600 the figure on the back of heightened losses in the Greenback. In the meantime, investors continue to pencil in two potential rate cuts by the Fed for the remainder of the year.

Gold consolidates its gains near $3,380
Gold maintains its weekly rebound well in place, now trading in the sub-$3,400 region per troy ounce in response to the persistent selling bias in the US Dollar, declining US yields across the curve and growing geopolitical tensions.

Cardano Price Forecast: Whales acquire 310 million ADA amid potential triangle breakout
Cardano (ADA) shows weakness as it reverses from an overhead trendline of a triangle pattern. The altcoin edges lower by over 1% at press time on Thursday, fueling a steeper correction in its Open Interest. Amid weakness, Cardano whales have acquired 310 million ADA tokens so far this month, projecting increased confidence as the triangle pattern nears resolution.

US tariffs here to stay, trade deals ‘largely symbolic’
Despite legal challenges to IEEPA tariffs, US trade policy remains firm. Tariffs on steel and aluminium have doubled, and new sectoral tariffs are expected. Trade deals may emerge, but most will be symbolic. Effective tariff rates will stay high throughout 2025.