EUR/USD Price Forecast: Corrective decline underway

EUR/USD Current price: 1.0477
- Financial markets started the week in slow motion, US Dollar remains weak.
- United States markets will remain closed amid the celebration of President's Day.
- The EUR/USD pair is under pressure in the near term and could test the 1.0400 region.
The EUR/USD pair trades just short of the 1.0500 threshold on Monday, unable to extend its recent rally yet holding ground amid persistent broad US Dollar (USD) weakness. The pair hit 1.0514 on Friday, shedding a few pips ahead of the weekly close.
European data fell short of impressing, keeping Euro (EUR) gains limited. The European Union (EU) Trade Balance posted a seasonally adjusted surplus of €14.6 billion in December, improving from the €13.3 billion posted in November.
Meanwhile, Asian and European equities are giving little clues, as most indexes trade in the green, albeit with limited movements amid the poor performance of the tech sector.
Markets’ limited activity is being exacerbated by a holiday in the United States (US) as the country celebrates President’s Day, with stocks’ and bonds’ markets closed until Tuesday.
EUR/USD short-term technical outlook
The EUR/USD pair is pretty much flat on a daily basis, trading inside a limited 30-pip range. From a technical point of view, the daily chart shows the pair holds well above its 20 Simple Moving Average (SMA), which anyway has lost its upward strength and hovers around 1.0400. The 100 SMA, in the meantime, maintains its firmly bearish slope far above the current level, suggesting longer-term sellers are still present. Finally, technical indicators show contradictory directional strength yet remain within positive levels, limiting the bearish potential in the foreseeable sessions.
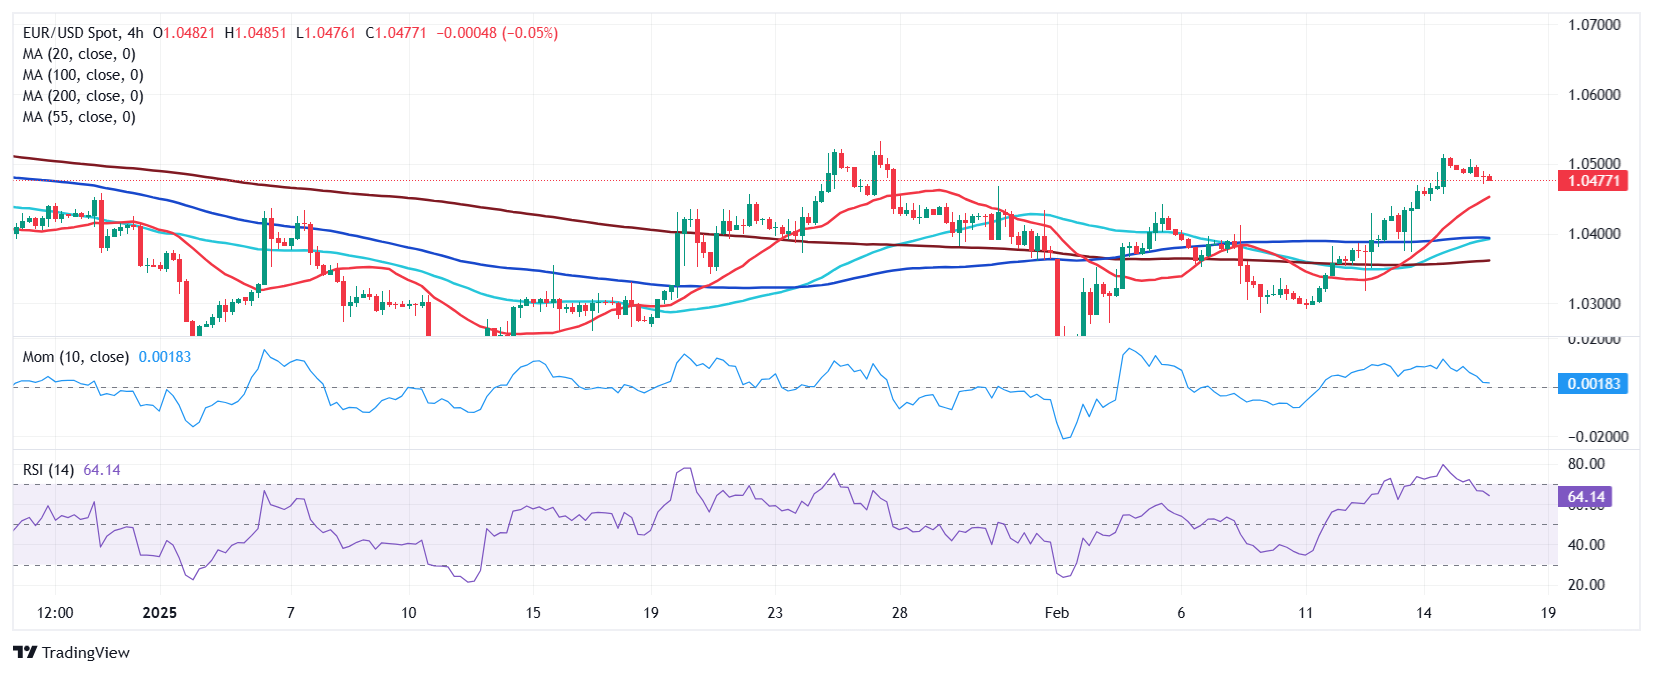
In the near term, and according to the 4-hour chart, the risk of another leg south has increased. Technical indicators retreated from overbought levels, and remain within positive levels, yet the Momentum indicator heads firmly south. The Relative Strength Index (RSI) indicator, in the meantime, turned flat at around 59. Finally, the EUR/USD pair develops well above all its moving averages, with a bullish 20 SMA providing dynamic support at around 1.0440. The USD may find room to recover some ground, yet in the wider perspective the risk skews to the downside.
Support levels: 1.0440 1.0400 1.0360
Resistance levels: 1.0515 1.0550 1.0590
Author

Valeria Bednarik
FXStreet
Valeria Bednarik was born and lives in Buenos Aires, Argentina. Her passion for math and numbers pushed her into studying economics in her younger years.


