EUR/USD Current price: 1.0326
- US President Donald Trump’s tariffs continue to drive the market’s mood.
- United States employment-related figures taking centre stage this week.
- EUR/USD at risk of resuming its slide, 1.0220 in sight once 1.0300 gives up.
The EUR/USD pair held above 1.0300 throughout the first half of Tuesday, reaching the 1.0340 region in the mid-European session, yet unable to extend its Monday recovery. Concerns about United States (US) President Donald Trump’s announcement on tariffs receded after talks with Mexican and Canadian authorities.
Mexico's President Claudia Sheinbaum and Canadian Prime Minister Justin Trudeau announced late Monday that Trump will postpone levies for 30 days, as both countries committed to increase border security.
Tensions with China, however, persist. The Asian giant announced tariffs of 15% on American Coal and LNG and 10% on US oil and agricultural machinery. Still, the tariff’s deadline with China would arrive on February 10, leaving room for both economies to stuck a deal.
Data-wise, the European macroeconomic calendar had nothing relevant to offer. As for the US, the country will release December Factory Orders and JOLTS Job Openings for the same month. Employment-related figures are relevant ahead of the release of the January Nonfarm Payrolls report on Friday.
EUR/USD short-term technical outlook
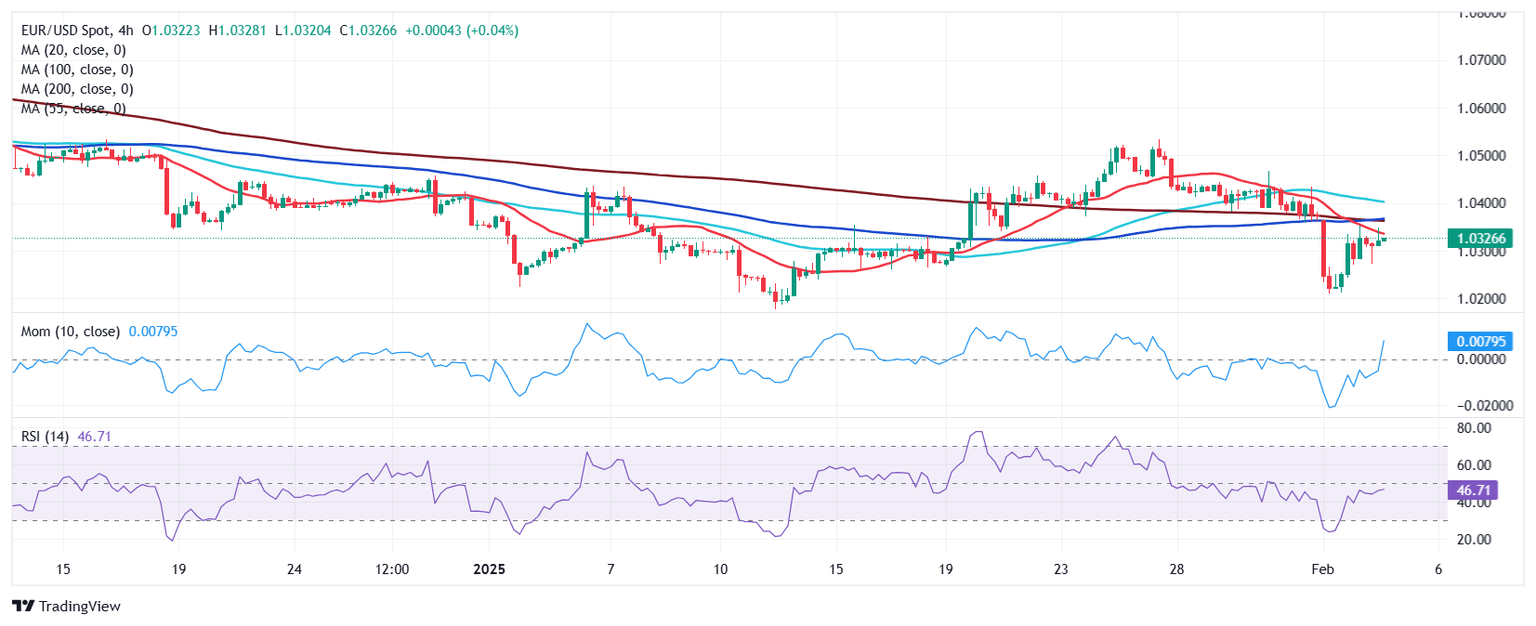
The EUR/USD pair retreated from an intraday peak of 1.0349 and trades with modest losses around 1.0320 ahead of the American opening. In the daily chart, the risk of a bearish extension has increased. The pair remains below a mildly bearish 20 Simple Moving Average (SMA), acting as dynamic resistance at around 1.0355. The 100 SMA, in the meantime, accelerates south far above the shorter one, reflecting increased selling interest. Finally, technical indicators aim south, with the Momentum indicator still hovering within neutral levels but the Relative Strength Index (RSI) indicator heading firmly lower at around 42.
The near-term picture is bearish. In the 4-hour chart, EUR/USD repeatedly found sellers around a bearish 20 SMA, which has crossed below flat 100 and 200 SMAs, usually a sign of increased selling interest. At the same time, technical indicators resumed their slides within negative territory, albeit with modest downward strength.
Support levels: 1.0300 1.0265 1.0220
Resistance levels: 1.0355 1.0390 1.0440
Information on these pages contains forward-looking statements that involve risks and uncertainties. Markets and instruments profiled on this page are for informational purposes only and should not in any way come across as a recommendation to buy or sell in these assets. You should do your own thorough research before making any investment decisions. FXStreet does not in any way guarantee that this information is free from mistakes, errors, or material misstatements. It also does not guarantee that this information is of a timely nature. Investing in Open Markets involves a great deal of risk, including the loss of all or a portion of your investment, as well as emotional distress. All risks, losses and costs associated with investing, including total loss of principal, are your responsibility. The views and opinions expressed in this article are those of the authors and do not necessarily reflect the official policy or position of FXStreet nor its advertisers. The author will not be held responsible for information that is found at the end of links posted on this page.
If not otherwise explicitly mentioned in the body of the article, at the time of writing, the author has no position in any stock mentioned in this article and no business relationship with any company mentioned. The author has not received compensation for writing this article, other than from FXStreet.
FXStreet and the author do not provide personalized recommendations. The author makes no representations as to the accuracy, completeness, or suitability of this information. FXStreet and the author will not be liable for any errors, omissions or any losses, injuries or damages arising from this information and its display or use. Errors and omissions excepted.
The author and FXStreet are not registered investment advisors and nothing in this article is intended to be investment advice.
Recommended Content
Editors’ Picks

EUR/USD hits two-week tops near 1.0500 on poor US Retail Sales
The selling pressure continues to hurt the US Dollar and now encourages EUR/USD to advance to new two-week peaks in levels just shy of the 1.0500 barrier in the wake of disappointing results from US Retail Sales.

GBP/USD surpasses 1.2600 on weaker US Dollar
GBP/USD extends its march north and reclaims the 1.2600 hurdle for the first time since December on the back of the increasing downward bias in the Greenback, particularly exacerbated following disheartening US results.

Gold maintains the bid tone near $2,940
The continuation of the offered stance in the Greenback coupled with declining US yields across the board underpin the extra rebound in Gold prices, which trade at shouting distance from their record highs.

Weekly wrap: XRP, Solana and Dogecoin lead altcoin gains on Friday
XRP, Solana (SOL) and Dogecoin (DOGE) gained 5.91%, 2.88% and 3.36% respectively on Friday. While Bitcoin (BTC) hovers around the $97,000 level, the three altcoins pave the way for recovery and rally in altcoins ranking within the top 50 cryptocurrencies by market capitalization on CoinGecko.

Tariffs likely to impart a modest stagflationary hit to the economy this year
The economic policies of the Trump administration are starting to take shape. President Trump has already announced the imposition of tariffs on some of America's trading partners, and we assume there will be more levies, which will be matched by foreign retaliation, in the coming quarters.

The Best Brokers of the Year
SPONSORED Explore top-quality choices worldwide and locally. Compare key features like spreads, leverage, and platforms. Find the right broker for your needs, whether trading CFDs, Forex pairs like EUR/USD, or commodities like Gold.